
68 Data Creation Statistics for 2026: How Much Data Is Generated Every Day?
Every search, message, video, and sensor reading adds to a pile of data that has become the raw material of the digital economy.
The rise of AI has made that pile more valuable, and more closely watched, than ever before: the companies training models and building data centers now treat data volume as a strategic resource.
This page collects the most reliable numbers on how much data the world generates, moves, and stores, drawn directly from primary sources.
Here are 68 statistics that show the scale of it all.
Top Data Statistics
- Data centres consumed 415 terawatt-hours of electricity in 2024 — around 1.5% of the world’s total electricity consumption (IEA).
- The world generated 132.4 zettabytes of data in 2023, according to IDC’s Global DataSphere research (IDC).
- People send and receive more than 361 billion emails every day worldwide in 2024, a figure forecast to top 424 billion by 2028 (The Radicati Group).
- Creators upload more than 20 million videos to YouTube every single day (YouTube).
- Global mobile network data traffic reached 210 exabytes per month in Q1 2026, up 22% year-on-year (Ericsson Mobility Report).
- YouTube Shorts now averages 200 billion views every day, per CEO Neal Mohan’s January 2026 letter (YouTube, 2026 letter).
- An average of 3.60 billion people used at least one Meta app — Facebook, Instagram, WhatsApp, or Messenger — every day in June 2026 (Meta).
How Much Data Is Generated Every Day?
There is no official daily counter for the world’s data. The standard industry yardstick, IDC’s Global DataSphere, measures how much data is created, captured, replicated, and consumed each year, so the most defensible answers come as annual figures.
1. The world generated 132.4 zettabytes of data in 2023, according to IDC’s Global DataSphere research (IDC).
2. IDC projects annual data generation will reach 393.9 zettabytes in 2028, growing at a 24.4% compound annual rate from 2023 (IDC).
3. IDC’s latest forecast puts the Global DataSphere on track to surpass 700 zettabytes annually by 2030 (IDC Global DataSphere Forecast).
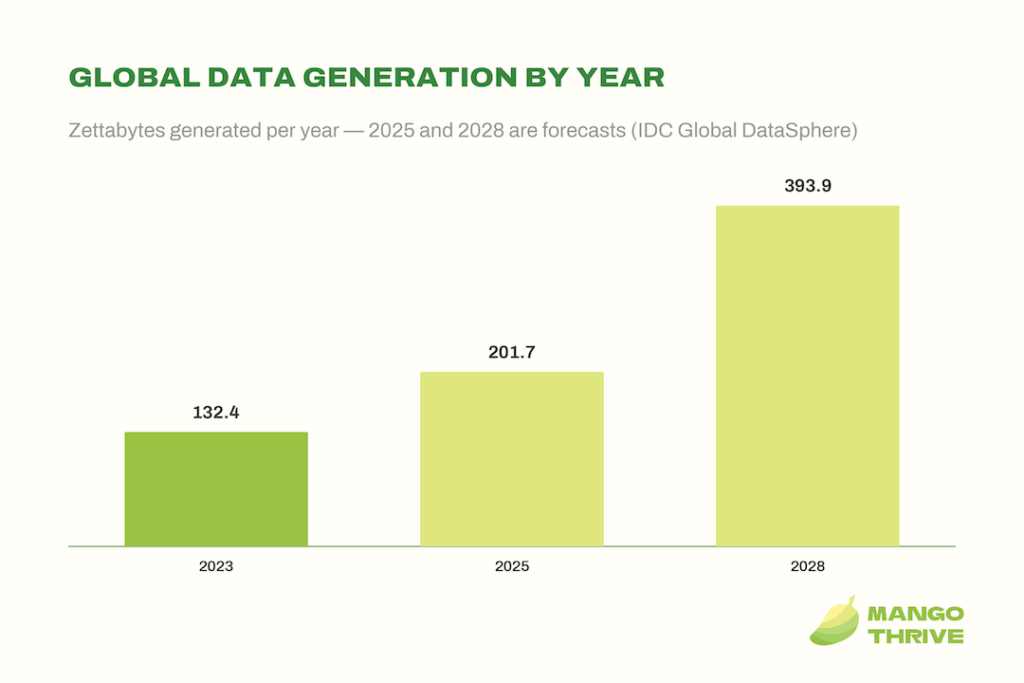
Global data generation by year — IDC
| Year | Data generated worldwide (zettabytes) |
|---|---|
| 2023 | 132.4 |
| 2025 (forecast) | 201.7 |
| 2028 (forecast) | 393.9 |
Source: IDC, Table 1, pp. 3–4
Global Data Growth Over Time
The historical numbers below show how quickly the curve has steepened. Each figure is tied to the year it was published, since older forecasts tell you what the industry expected, not what happened.
4. Back in 2020, the world created or replicated 64.2 zettabytes of data, according to IDC (IDC 2021 press release).
5. IDC forecast global data creation and replication to grow at a 23% compound annual growth rate over 2020–2025 (IDC 2021 press release).
6. IDC predicted in 2020 that the world would create more data over the following three years than it had over the prior 30 years (IDC 2020 press release).
7. As of 2020, IDC put the ratio of unique data to replicated data at roughly 1:9, and expected it to reach 1:10 by 2024 (IDC 2020 press release).
8. The landmark Seagate-sponsored IDC “Data Age 2025” study projected in 2020 that the Global Datasphere would grow from 45 zettabytes in 2019 to 175 zettabytes by 2025 (Seagate–IDC).
How Much Data Is Actually Stored?
Creating data and keeping it are very different things. Most of what the world generates is consumed once and overwritten, which is why storage numbers run far below creation numbers.
9. While most data created is never stored, IDC estimates the world will store around 13.6 zettabytes of data in 2028 (IDC, via Western Digital).
10. Less than 2% of the data created and replicated in 2020 was saved and retained into 2021, per IDC (IDC 2021 press release).
11. The world’s installed base of storage capacity reached 6.7 zettabytes in 2020, growing more slowly than data creation itself, per IDC (IDC 2021 press release).
12. The 2020 Data Age study predicted 46% of the world’s stored data would reside in public cloud environments by 2025 (Seagate–IDC).
13. IDC predicted that nearly 25% of the Global Datasphere would be real-time data by 2025 (Seagate–IDC).
How Much Data Moves Across the Internet?
Once created, data has to travel. These figures track the traffic flowing over fixed and mobile networks, and through the exchange points where networks hand data to each other.
14. Fixed broadband networks carried 7.3 zettabytes of internet traffic in 2025 — almost five times the 1.5 zettabytes that flowed over mobile broadband (ITU).
15. Global internet traffic grew 19% in 2025, up from 17% growth in 2024 (Cloudflare).
16. 79 exabytes of data were exchanged across DE-CIX’s internet exchanges worldwide in 2025, a 16% increase over 2024 (DE-CIX).
17. Internet traffic across DE-CIX’s global exchanges hit an all-time record of 29.5 terabits per second on July 7, 2026, as fans streamed a FIFA World Cup match (DE-CIX, July 2026).
18. 6 billion people — 74% of the world’s population — were online in 2025, up from 5.8 billion in 2024 (ITU).
19. 2.2 billion people remained offline in 2025, most of them in low- and middle-income countries (ITU).
20. Fixed broadband reached 20 subscriptions per 100 inhabitants worldwide in 2025, surpassing the historic peak of 19 fixed-telephone lines per 100 set in 2006 (ITU).
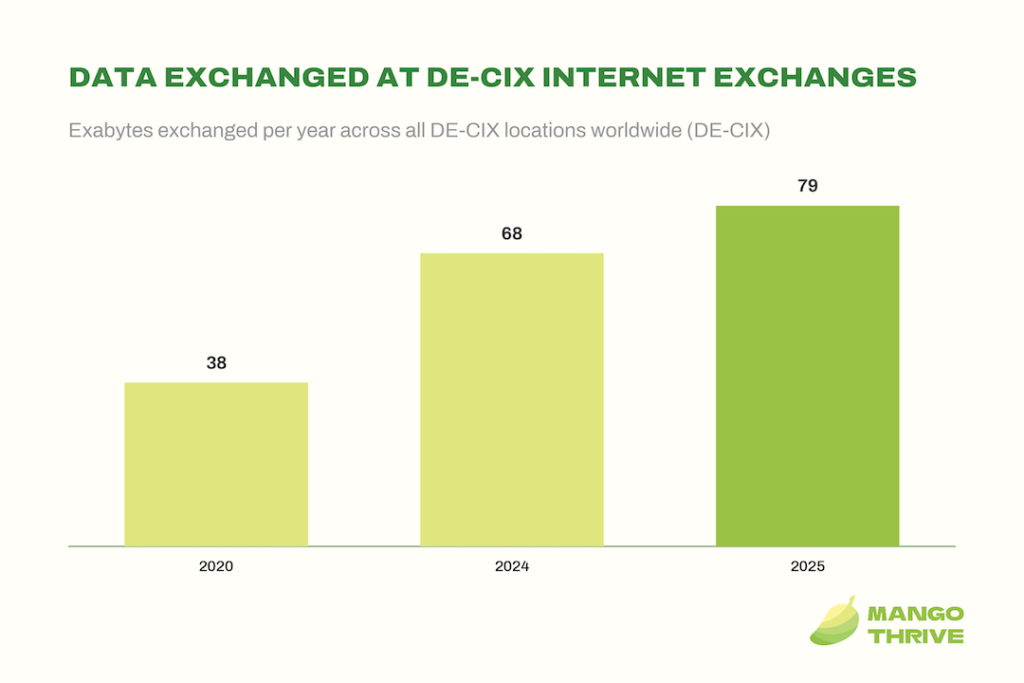
Data exchanged at DE-CIX internet exchanges
| Year | Data exchanged at DE-CIX exchanges (exabytes) |
|---|---|
| 2020 | 38 |
| 2024 | 68 |
| 2025 | 79 |
Source: DE-CIX
Mobile Data Traffic Statistics
Smartphones are the most personal data generators most people own. The figures below come from Ericsson’s network measurements and the ITU’s global connectivity tracking.
21. Global mobile network data traffic reached 210 exabytes per month in Q1 2026, up 22% year-on-year (Ericsson Mobility Report).
22. Global mobile data traffic ended 2025 at 146 exabytes per month — or 203 exabytes per month including fixed wireless access (Ericsson Mobility Report).
23. Ericsson forecasts total mobile network data traffic will grow by a factor of around 2.5 to reach 515 exabytes per month by 2031 (Ericsson Mobility Report).
24. The share of mobile data traffic carried over 5G jumped from 34% to 48% during 2025, and is projected to reach 85% by 2031 (Ericsson Mobility Report).
25. The average smartphone consumed 22 GB of mobile data per month globally at the end of 2025 (Ericsson Mobility Report).
26. 5G subscriptions passed 3.1 billion in Q1 2026 — adding 162 million in a single quarter — and are forecast to reach 6.4 billion by the end of 2031 (Ericsson Mobility Report).
27. Fixed wireless access generated 28% of global mobile network data traffic at the end of 2025, and is projected to reach around 187 exabytes per month by 2031 (Ericsson Mobility Report).
28. 5G networks covered 55% of the world’s population in 2025 — 84% in high-income countries but only 4% in low-income countries (ITU).
29. Video accounted for around 75% of all mobile data traffic at the end of 2025 (Ericsson Mobility Report).
How much mobile data does one smartphone use per month?
The global average hides enormous regional differences, as Ericsson’s regional breakdown shows.
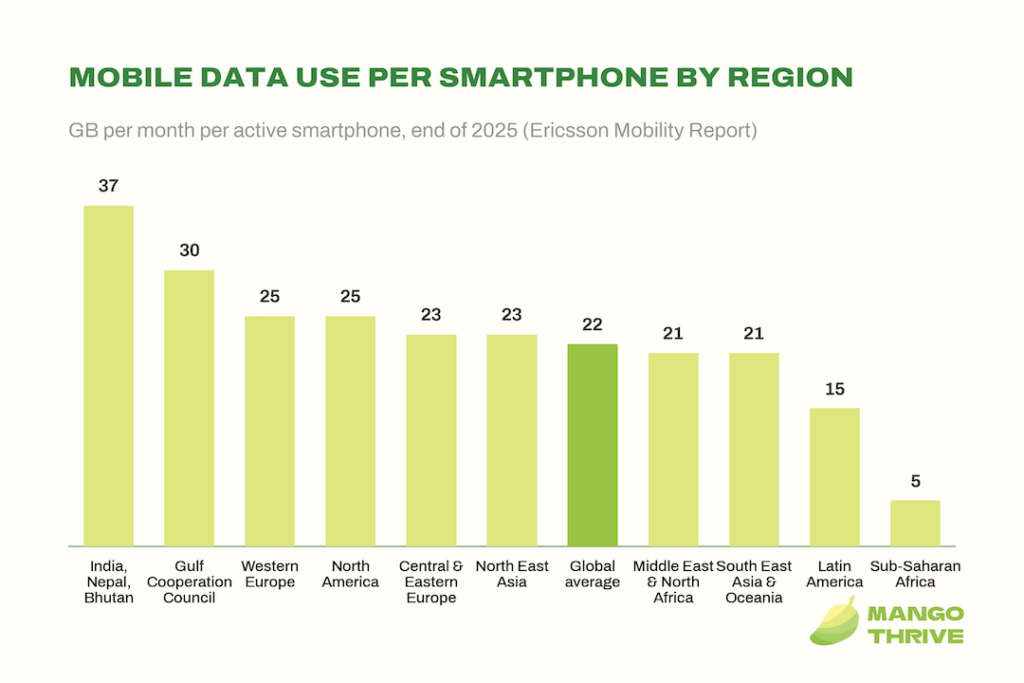
Mobile data use per smartphone by region
| Region | 2025 (GB/month) | 2031 forecast (GB/month) | CAGR 2025–2031 |
|---|---|---|---|
| India, Nepal, Bhutan | 37 | 70 | 11% |
| Gulf Cooperation Council | 30 | 49 | 8% |
| Western Europe | 25 | 59 | 15% |
| North America | 25 | 52 | 13% |
| Central and Eastern Europe | 23 | 50 | 14% |
| North East Asia | 23 | 45 | 12% |
| Global average | 22 | 42 | 12% |
| Middle East and North Africa | 21 | 47 | 14% |
| South East Asia and Oceania | 21 | 40 | 12% |
| Latin America | 15 | 32 | 14% |
| Sub-Saharan Africa | 5 | 12 | 14% |
Source: Ericsson, Mobile Data Traffic Outlook, Figure 9. Traffic per active smartphone refers to all traffic generated by that device, regardless of the number of subscriptions attached.
How Much Content Do Online Platforms Handle Every Day?
The clearest per-day numbers come from the platforms themselves. This is where the abstract zettabytes turn into searches, emails, uploads, and messages.
30. Google handles more than 5 trillion searches per year, the company disclosed in 2025 (Google).
31. People send and receive more than 361 billion emails every day worldwide in 2024, a figure forecast to top 424 billion by 2028 (The Radicati Group).
32. More than 4.4 billion people worldwide use email in 2024, projected to pass 4.9 billion by 2028 (The Radicati Group, press release).
How much video is uploaded to YouTube every day?
33. Creators upload more than 20 million videos to YouTube every single day (YouTube).

34. YouTube hosts more than 20 billion videos in total as of April 2025 (YouTube).
35. YouTube users posted an average of more than 100 million comments per day in 2024 (YouTube).
36. YouTube videos collected more than 3.5 billion likes per day on average in 2024 (YouTube).
37. YouTube Shorts now averages 200 billion views every day, per CEO Neal Mohan’s January 2026 letter (YouTube, 2026 letter).
38. In December 2025, more than 6 million viewers per day watched at least 10 minutes of auto-dubbed YouTube content (YouTube, 2026 letter).
39. Netflix members watched more than 95 billion hours of content in the first half of 2025 (Netflix).
40. Viewing on Netflix totaled 96 billion hours in the second half of 2025 (Netflix, H2 report).
How many messages do people send every day?
41. An average of 3.60 billion people used at least one Meta app — Facebook, Instagram, WhatsApp, or Messenger — every day in June 2026 (Meta).
42. WhatsApp passed 3 billion monthly users in 2025, per Mark Zuckerberg on Meta’s Q1 2025 earnings call (TechCrunch).
43. Back in 2020, WhatsApp was already delivering roughly 100 billion messages every day — the last daily-volume figure Meta has disclosed (TechCrunch, 2020).
44. Americans exchanged nearly 2.2 trillion SMS and MMS text messages in 2024 (CTIA).
45. Americans also spent more than 2.4 trillion minutes on voice calls in 2024 (CTIA).
IoT and Connected Devices
People are no longer the only ones generating data at scale. Sensors, meters, vehicles, and machines add billions of always-on data sources.
46. IoT Analytics expects the number of connected IoT devices worldwide to grow 14% year-over-year to 21.1 billion by the end of 2025 (IoT Analytics).
47. IoT Analytics estimates connected IoT devices will reach 39 billion globally in 2030, a 13.2% CAGR from 2025 (IoT Analytics).
48. Mobile operators worldwide generated $18.4 billion in revenue from 4.1 billion cellular IoT connections in 2024 (IoT Analytics).
49. Ericsson counts 22.3 billion total IoT connections worldwide in 2025 — including short-range devices — and forecasts 47.1 billion by 2031 (Ericsson, IoT Connections Outlook).
Data Centers, Cloud, and AI Infrastructure
All of that data needs somewhere to live and something to process it. The AI build-out is reshaping how much the world spends on the places that store and process data.
50. The number of large data centers operated by hyperscale providers climbed to 1,297 worldwide as of Q3 2025, nearly tripling since early 2018 (Synergy Research Group).
51. Quarterly capital spending by hyperscale operators grew almost 180% in three years, reaching $142 billion in Q3 2025 (Synergy Research Group).
52. Synergy Research expects total hyperscale data center capacity to double in just over twelve quarters, driven by AI infrastructure investment (Synergy Research Group).
53. Enterprise spending on cloud infrastructure services hit $143 billion in Q2 2026, up 43% year-over-year, with trailing-twelve-month revenues reaching $500 billion (Synergy Research Group, Q2 2026).
54. Data centres consumed 415 terawatt-hours of electricity in 2024 — around 1.5% of the world’s total electricity consumption (IEA).
55. The IEA projects data centre electricity consumption will more than double to around 945 terawatt-hours by 2030 — slightly more than Japan’s total electricity consumption today (IEA).
56. Global investment in data centres nearly doubled since 2022, reaching half a trillion dollars in 2024 (IEA).
57. A typical AI-focused data centre consumes as much electricity as 100,000 households — and the largest ones under construction will consume 20 times as much (IEA).
58 Epoch AI estimates the stock of human-generated public text available for AI training at around 300 trillion tokens — and projects language models will fully utilize it between 2026 and 2032 (Epoch AI).
Who Creates All This Data? People and Businesses
Behind the aggregate numbers sit two producers: individuals feeding social and video platforms, and enterprises generating operational data that never reaches a public feed.
59. Unstructured data accounted for approximately 92.9% of all data generated worldwide in 2023 (IDC).
60. IDC forecasts unstructured data’s share of global data generation will decline to less than 83% by 2028, as structured data grows faster (IDC).
61. IDC forecasts the enterprise DataSphere to grow from 84,876 exabytes of data generated in 2023 to 317,133 exabytes in 2028, a 30.2% compound annual growth rate (IDC).
62. Structured data made up less than 12% of enterprise data generated in 2023, but IDC expects it to reach about 22% by 2028 (IDC).
63. The typical online adult spends a weekly average of 18 hours and 36 minutes on social and video feeds combined, per GWI survey data (GWI, via DataReportal).
64. Women aged 16 to 24 spend an average of 25 hours and 45 minutes per week scrolling social and video feeds — more than 3 hours and 40 minutes per day, per GWI (GWI, via DataReportal).
65. The typical online adult now spends roughly 33.5 hours per week consuming online media of all kinds, including streaming TV, per Kepios analysis of GWI data (DataReportal).
66. In 2020, more than 5 billion consumers interacted with data every day — a number IDC expected to reach 6 billion, or 75% of the world’s population, by 2025 (Seagate–IDC).
67. 63% of organizations either lack, or are unsure they have, the right data management practices for AI, according to a 2024 Gartner survey (Gartner).
68. Gartner predicts that through 2026, organizations will abandon 60% of AI projects that are unsupported by AI-ready data (Gartner).
Conclusion
The data shows a world that produces far more information than it can keep, moves an ever-larger share of it over mobile networks, and increasingly relies on machines rather than people to generate it. The AI build-out is reshaping both ends of the pipeline: models consume the world’s accumulated text while data centers race to store and process what comes next. Expect the gap between what gets created and what gets kept to keep widening, and expect the infrastructure bill to keep climbing with it.