
Mobile vs Desktop Website Traffic (2026)
Most websites get visitors from both phones and computers. The split between them is less settled than it looks. Trackers count page views, visits or requests, and each gets a different answer. The statistics below show where traffic comes from, how it converts, how long people stay, and how sites perform on each device.
Top Mobile vs Desktop Traffic Statistics
- 49.34% of worldwide web page views came from mobile devices in August 2026, versus 49.11% from desktops (StatCounter, Desktop vs Mobile vs Tablet, August 2026).
- 66.55% of worldwide web traffic came from mobile devices in August 2026, versus 32.08% from desktops, according to Similarweb’s estimate (Similarweb, Mobile vs. Desktop vs. Tablet Traffic Market Share).
- 69.9% of website traffic came from mobile devices in Q4 2025, in Contentsquare’s benchmark (Contentsquare, 2026 Digital Experience Benchmark).
- More than 50% of US online spend came from mobile devices in 2025, the first full year to pass that mark, according to Adobe (Adobe, Holiday Shopping Report).
- 30% of website visits came from desktop in Q4 2025 in Contentsquare’s benchmark, yet desktop delivered 47% of total time spent (Contentsquare, 2026 Digital Experience Benchmark).
- Over 90% of referral traffic from AI search engines came from desktop users in April 2025, per BrightEdge (BrightEdge, mobile AI search press release).
- 48% of mobile websites had good Core Web Vitals in 2025, versus 56% of desktop websites (HTTP Archive, Web Almanac 2025 Performance).
What Percent of Website Traffic Comes From Mobile vs Desktop?
StatCounter tracks which devices load pages on the websites that use its code. Its latest month puts mobile and desktop almost level.
In StatCounter’s data, “market share” is based on page views, not unique visitors.
1. 49.34% of worldwide web page views came from mobile devices in August 2026, versus 49.11% from desktops (StatCounter, Desktop vs Mobile vs Tablet, August 2026).
2. 52.03% of worldwide web page views came from mobile devices between September 2025 and August 2026, versus 46.53% from desktops (StatCounter, Desktop vs Mobile vs Tablet, last 12 months).
3. 50.12% of worldwide web page views came from mobile in August 2026 when tablets are left out, versus 49.88% from desktops (StatCounter, Desktop vs Mobile, August 2026).
What Do Other Data Sources Show?
Other trackers measure different things, so their mobile shares differ from StatCounter’s. Each figure below uses its own method.
In Similarweb’s platform data, “traffic market share” is an estimate built from analytics that websites and apps share with Similarweb. Similarweb says it covers a subset of sites.
4. 66.55% of worldwide web traffic came from mobile devices in August 2026, versus 32.08% from desktops, according to Similarweb’s estimate (Similarweb, Mobile vs. Desktop vs. Tablet Traffic Market Share).
In Cloudflare’s data, each request is sorted as coming from a mobile, desktop or other type of device, using information in each request’s User-Agent header.
5. 43% of requests to Cloudflare worldwide came from mobile devices in 2025, up from 41% in 2024 (Cloudflare Radar 2025 Year in Review). The rest came from laptops and desktops.
6. 117 countries and regions got more than half of their Cloudflare requests from mobile devices in 2025 (Cloudflare Radar 2025 Year in Review). Sudan and Malawi led that list.
7. 5.1% of requests from Gibraltar came from mobile devices in 2025, per Cloudflare (Cloudflare Radar 2025 Year in Review). Cloudflare says it was the only country or region below 10%.
8. 99 billion web and app sessions across 6,500+ websites feed Contentsquare’s 2026 Digital Experience Benchmark (Contentsquare, 2026 Digital Experience Benchmark). The report compares the last quarter of 2025 with the same quarter of 2024.
9. 69.9% of website traffic came from mobile devices in Q4 2025, in Contentsquare’s benchmark (Contentsquare, 2026 Digital Experience Benchmark).
| Industry | Mobile share of website traffic, Q4 2025 | Desktop share of website traffic, Q4 2025 |
|---|---|---|
| Travel & Hospitality | 77.5% | 22.5% |
| Retail | 77.0% | 23.0% |
| Energy, Utilities & Construction | 65.0% | 35.0% |
| Media | 57.9% | 42.1% |
| Financial Services | 52.1% | 47.9% |
| Manufacturing | 47.2% | 52.8% |
| Software | 46.1% | 53.9% |
| Telecommunications | 35.7% | 64.3% |
| Services | 20.1% | 79.9% |
Source: Contentsquare, 2026 Digital Experience Benchmark. Websites that use Contentsquare, grouped by industry.
10. Desktop traffic fell 7.3% year over year in Q4 2025, the biggest drop of any device in Contentsquare’s benchmark (Contentsquare, 2026 Digital Experience Benchmark).
How Has Mobile vs Desktop Traffic Changed Over Time?
Mobile’s share of page views has grown over the past decade and a half. The monthly figures in the last year have moved up and down.
11. 2.94% of worldwide web page views came from mobile devices in 2010, versus 97.06% from desktops (StatCounter, Desktop vs Mobile vs Tablet, 2010–2026).
12. 51.3% of worldwide internet usage came from mobile and tablet devices in October 2016, versus 48.7% from desktops, StatCounter announced (StatCounter press release, November 2016). StatCounter called it the first time mobile and tablet beat desktop worldwide.
13. 51.56% of worldwide web page views came from mobile devices in 2017, up from 43.59% in 2016 (StatCounter, Desktop vs Mobile vs Tablet, 2010–2026).
14. 60.95% of worldwide web page views came from mobile devices in 2024, versus 37.02% from desktops (StatCounter, Desktop vs Mobile vs Tablet, 2010–2026).
15. 58.5% of worldwide web page views came from mobile devices in 2025, versus 39.92% from desktops (StatCounter, Desktop vs Mobile vs Tablet, 2010–2026).
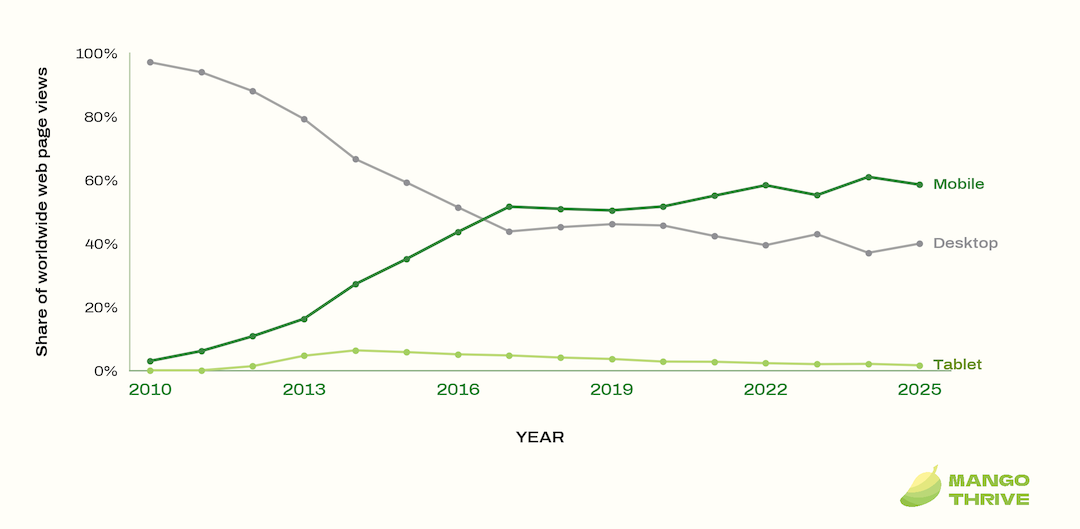
Share of worldwide web page views by device, 2010 to 2025
Source: StatCounter, Desktop vs Mobile vs Tablet, 2010–2026. Share of worldwide web page views by year. 2026 is left out because the year is not over.
16. 51.67% of worldwide web page views came from mobile devices from January to August 2026, versus 46.82% from desktops (StatCounter, Desktop vs Mobile vs Tablet, January–August 2026).
17. 49.72% of worldwide web page views came from desktops in October 2025, versus 48.99% from mobile devices (StatCounter, Desktop vs Mobile vs Tablet, monthly).
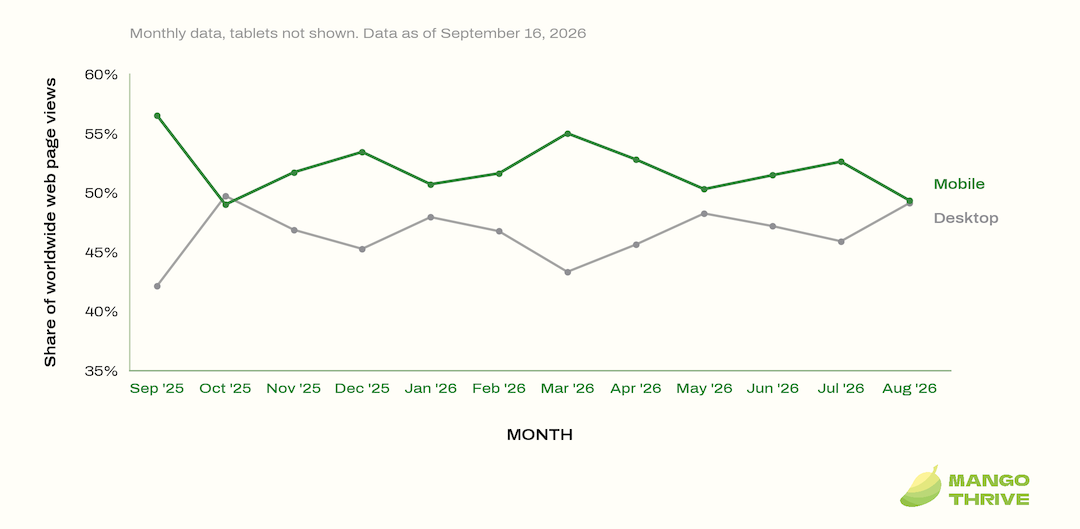
Monthly share of worldwide web page views, mobile vs desktop
Source: StatCounter, Desktop vs Mobile vs Tablet, monthly. Share of worldwide web page views by month, September 2025 to August 2026. Tablets are not shown. Data as of September 16, 2026.
What Share of Web Traffic Comes From Tablets?
Tablets make up a small slice of web traffic.
18. 1.54% of worldwide web page views came from tablets in August 2026 (StatCounter, Desktop vs Mobile vs Tablet, August 2026).
19. 1.45% of worldwide web page views came from tablets between September 2025 and August 2026 (StatCounter, Desktop vs Mobile vs Tablet, last 12 months).
20. 6.29% of worldwide web page views came from tablets in 2014, versus 1.58% in 2025 (StatCounter, Desktop vs Mobile vs Tablet, 2010–2026).
21. 14% of UK women’s online time went to tablets in May 2025, versus 10% for men (Ofcom, Online Nation 2025).
Mobile vs Desktop Traffic by Region and Country
The split between mobile and desktop changes a lot from one part of the world to another. The tables below use StatCounter’s twelve-month view rather than a single month.
22. 58.38% of web page views in Asia came from mobile devices between September 2025 and August 2026, versus 40.63% from desktops (StatCounter, Desktop vs Mobile vs Tablet, Asia, last 12 months).
| Continent | Mobile share of web page views, Sep 2025–Aug 2026 | Desktop share, Sep 2025–Aug 2026 | Tablet share, Sep 2025–Aug 2026 |
|---|---|---|---|
| Africa | 60.96% | 38.05% | 0.98% |
| Asia | 58.38% | 40.63% | 0.99% |
| Europe | 46.82% | 51.02% | 2.16% |
| North America | 43.78% | 54.06% | 2.16% |
| Oceania | 44.4% | 52.62% | 2.98% |
| South America | 38.86% | 60.71% | 0.43% |
Source: StatCounter, Desktop vs Mobile vs Tablet Market Share. Twelve-month view, September 2025 to August 2026, one continent at a time.
23. 71.34% of web page views in India came from mobile devices between September 2025 and August 2026, versus 28.17% from desktops (StatCounter, Desktop vs Mobile vs Tablet, India, last 12 months).
| Country | Mobile share of web page views, Sep 2025–Aug 2026 | Desktop share, Sep 2025–Aug 2026 | Tablet share, Sep 2025–Aug 2026 |
|---|---|---|---|
| United States | 42.82% | 55.01% | 2.17% |
| Canada | 44.86% | 52.15% | 2.99% |
| Mexico | 50.66% | 48.35% | 0.99% |
| Brazil | 32.29% | 67.31% | 0.41% |
| United Kingdom | 48.84% | 46.73% | 4.43% |
| Germany | 44.77% | 53.41% | 1.82% |
| France | 48.63% | 49.03% | 2.35% |
| India | 71.34% | 28.17% | 0.5% |
| China | 40.31% | 58.63% | 1.06% |
| Japan | 44% | 53.95% | 2.04% |
| South Korea | 47.01% | 52.18% | 0.82% |
| Indonesia | 48.2% | 51.39% | 0.41% |
| Vietnam | 56.24% | 42.85% | 0.91% |
| Nigeria | 67.61% | 31.97% | 0.42% |
| Egypt | 67.01% | 30.72% | 2.27% |
| South Africa | 64% | 35.33% | 0.67% |
| Kenya | 44.46% | 54.83% | 0.71% |
| Australia | 44.69% | 52.28% | 3.03% |
Source: StatCounter, Desktop vs Mobile vs Tablet Market Share. Twelve-month view, September 2025 to August 2026, one country at a time.
Which Devices Do People Use to Go Online?
The figures below come from surveys and official records. They count people or internet subscribers, not page views.
24. 89.85% of people aged 16–74 in the EU used the internet on a mobile phone in 2025, versus 30.63% on a desktop computer (Eurostat, internet use by device). People could name more than one device.
25. 89.42% of people aged 16–74 in Türkiye used the internet on a mobile phone in 2025, versus 13.94% on a desktop computer (Eurostat, internet use by device).
26. 97% of Australian adults used a mobile phone to go online in the 6 months to June 2025, up from 95% in 2024 (ACMA, How we use the internet 2025).
27. 94.18% of India’s internet subscribers used mobile devices to access the internet at the end of March 2026, per TRAI (TRAI, Performance Indicators Jan–Mar 2026). Wired subscribers made up 4.26%.
28. 91% of U.S. adults owned a smartphone in 2025, up from 35% in Pew’s first smartphone survey in 2011 (Pew Research Center, Mobile Fact Sheet).
29. 16% of U.S. adults were “smartphone-only” internet users in 2025 (Pew Research Center, Mobile Fact Sheet). That means they own a smartphone but do not have home broadband.
30. 27% of U.S. adults aged 18–29 were smartphone-only internet users in 2025, versus 11% of those aged 30–49 (Pew Research Center, Mobile Fact Sheet).
31. 34% of U.S. adults in households earning under $30,000 were smartphone-only internet users in 2025, versus 4% in households earning $100,000 or more (Pew Research Center, Mobile Fact Sheet).
Do Mobile or Desktop Visitors Convert Better?
More visits come from phones in several datasets, but a visit does not always end in a purchase. These figures cover conversion rates and online sales.
32. Around 2% is the average conversion rate on mobile web, versus 3.4% on desktop, in Contentsquare’s 2026 benchmark (Contentsquare, 2026 Digital Experience Benchmark).
33. Desktop conversion rates fell 7.9% year over year in Q4 2025, a larger drop than on mobile, per Contentsquare (Contentsquare, 2026 Digital Experience Benchmark).
34. 3.7% was the desktop conversion rate on retail sites in Q4 2025, versus 2% on mobile, per Contentsquare (Contentsquare, 2026 Digital Experience Benchmark).
35. 4.5% was the desktop conversion rate on travel and hospitality sites in Q4 2025, versus 2.1% on mobile, per Contentsquare (Contentsquare, 2026 Digital Experience Benchmark).
36. 56.4% of US online holiday transactions happened on a smartphone in the 2025 season, up from 54.5% in 2024 (Adobe, 2025 holiday shopping season results).
37. More than 50% of US online spend came from mobile devices in 2025, the first full year to pass that mark, according to Adobe (Adobe, Holiday Shopping Report).
38. 66.5% of US online sales on Christmas Day 2025 came through mobile, the highest mobile share of the season (Adobe, 2025 holiday shopping season results). Thanksgiving Day came next.
39. 57.5% of US online sales on Cyber Monday 2025 came through a mobile device, or $8.2 billion (Adobe, Cyber Monday 2025 results).
40. 41.4% of US Cyber Monday online sales came through mobile in 2020, according to Adobe (Adobe, Cyber Monday 2025 results).
41. 79.4% of US Buy Now, Pay Later transactions on Cyber Monday 2025 happened on a mobile device (Adobe, Cyber Monday 2025 results).
42. 38.8% of US online returns were made on a mobile device in the 2025 holiday season, versus 56.4% of online spend (Adobe, 2025 holiday shopping season results).
Do People Spend More Time on Mobile or Desktop?
Time spent tells a different story from visit counts. These figures cover time on websites, time online and time in apps.
43. 30% of website visits came from desktop in Q4 2025 in Contentsquare’s benchmark, yet desktop delivered 47% of total time spent (Contentsquare, 2026 Digital Experience Benchmark).
44. 4 minutes 46 seconds was the time spent per session on desktop in Contentsquare’s 2026 benchmark, versus 2 minutes 20 seconds on mobile (Contentsquare, 2026 Digital Experience Benchmark).
45. 77% of the time UK online adults spent online went to smartphones in May 2025, up from 75% a year earlier (Ofcom, Online Nation 2025).
46. 85% of daily online time for UK online adults aged 25–34 was spent on smartphones in May 2025 (Ofcom, Online Nation 2025). Ofcom says this age group was the most reliant on smartphones.
47. 5 hours 5 minutes a day was the average time UK 18–24-year-olds spent online on smartphones in May 2025 (Ofcom, Online Nation 2025).
48. 15% of UK men’s online time was spent on computers in May 2025, versus 8% for women (Ofcom, Online Nation 2025).
49. 5.3 trillion hours were spent in iOS and Google Play apps worldwide in 2025, roughly 3.6 hours a day per mobile user (Sensor Tower, State of Mobile 2026).
How Does Search Traffic Differ on Mobile and Desktop?
Search engines send traffic to websites from both phones and computers. The mix of search engines is not the same on each device.
In StatCounter’s data, “search engine market share” means the share of page views each search engine sends to websites, not the number of searches.
50. 95.55% of mobile search engine referrals worldwide came from Google in August 2026, versus 85.94% on desktop (StatCounter, Search Engine Market Share, mobile; desktop).
51. 8.91% of desktop search engine referrals worldwide came from Bing in August 2026, versus 0.6% on mobile (StatCounter, Search Engine Market Share, desktop; mobile).
52. 11.36% of tablet search engine referrals worldwide came from Bing in August 2026 (StatCounter, Search Engine Market Share, tablet).
53. 12.94% of desktop search engine referrals in the US came from Bing in August 2026 (StatCounter, Search Engine Market Share, US desktop).
54. 93.51% of mobile search engine referrals in the US came from Google in August 2026 (StatCounter, Search Engine Market Share, US mobile).
55. 85.94% of desktop search engine referrals worldwide came from Google in August 2026, up from 81.32% in August 2025 (StatCounter, Search Engine Market Share, desktop, 13 months).
56. 93% to 95% of US desktop searches on traditional search engines went to Google from Q4 2024 to Q4 2025, according to Datos (Datos, State of Search Q4 2025). Datos tracks a panel of desktop users.
57. 58% of Google’s mobile traffic to US and European brand websites came from Apple phones, according to BrightEdge data released in June 2025 (BrightEdge, mobile AI search press release).
Where Does AI Search Traffic Come From?
AI tools are a newer source of website visits. BrightEdge’s data points to desktop.
58. Over 90% of referral traffic from AI search engines came from desktop users in April 2025, per BrightEdge (BrightEdge, mobile AI search press release).
59. 94% of ChatGPT’s referral traffic to websites came from desktop users in April 2025, versus 6% from mobile, per BrightEdge (BrightEdge, mobile AI search press release).
60. 1.83% of US desktop activity went to AI tools in Q2 2026, up from 1.37% in Q2 2025, according to Datos (Datos, State of Search Q2 2026).
Are Websites Faster on Mobile or Desktop?
Pages have to work well on phones as well as computers. These figures compare site speed and mobile-friendly design on each device.
In the HTTP Archive Web Almanac, “good Core Web Vitals” means the main content appears within 2.5 seconds, the page responds to taps or clicks within 200 milliseconds, and the layout stays mostly stable, for most users.
61. 48% of mobile websites had good Core Web Vitals in 2025, versus 56% of desktop websites (HTTP Archive, Web Almanac 2025 Performance). The scores come from real Chrome users, measured in July 2025.
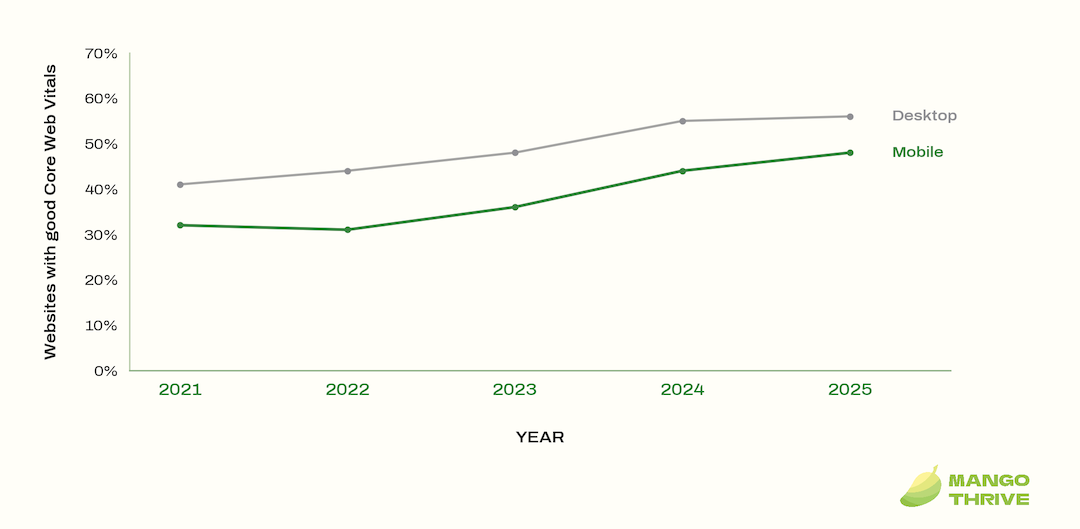
Share of websites with good Core Web Vitals, mobile vs desktop, 2021 to 2025
Source: HTTP Archive, Web Almanac 2025 Performance. Share of websites with good Core Web Vitals, 2021 to 2025, measured with real Chrome user data.
62. 51% of the top 1,000 websites had good Core Web Vitals on mobile in 2025, versus 59% on desktop (HTTP Archive, Web Almanac 2025 Performance).
63. 62% of mobile pages had a good Largest Contentful Paint score in 2025, versus 74% of desktop pages (HTTP Archive, Web Almanac 2025 Performance). This score tracks how quickly a page’s main content appears.
64. 77% of mobile websites had a good Interaction to Next Paint score in 2025, versus 97% on desktop (HTTP Archive, Web Almanac 2025 Performance). This score tracks how fast a page responds to taps and clicks.
65. 81% of mobile pages had a good Cumulative Layout Shift score in 2025, versus 72% of desktop pages (HTTP Archive, Web Almanac 2025 Performance). This score tracks how stable a page’s layout stays while it loads.
66. 1,916 milliseconds was the median Total Blocking Time on mobile in 2025, versus 92 milliseconds on desktop (HTTP Archive, Web Almanac 2025 Performance). This lab test measures how long a page is too busy to respond.
67. 44% of mobile websites had a good Time to First Byte in 2025, versus 55% of desktop websites (HTTP Archive, Web Almanac 2025 Performance). This score tracks how quickly the server starts sending the page.
68. 2.56 MB was the median mobile home page weight in 2025, versus 2.86 MB on desktop (HTTP Archive, Web Almanac 2025 Page Weight). Images took up the most bytes on both, followed by JavaScript and fonts.
69. 95.2% of mobile pages used the viewport meta tag in 2025, versus 93.1% of desktop pages (HTTP Archive, Web Almanac 2025 SEO). This tag tells a browser how to fit a page to the screen.
70. 92% of mobile pages passed Lighthouse’s legible font size test in 2025, the same as in 2024 (HTTP Archive, Web Almanac 2025 SEO). The test flags pages where too little visible text is large enough to read.
71. 19% of mobile sites restricted zooming in 2025, versus 21% of desktop sites (HTTP Archive, Web Almanac 2025 Accessibility). They block zoom or set a restrictive maximum zoom level.
Mobile-First Indexing
Google has published two updates on mobile-first indexing in recent years.
72. In October 2023, Google announced that its move to mobile-first indexing was complete, after starting mobile-first crawling in 2016 (Google Search Central, October 2023).
73. After July 5, 2024, Google said it would crawl and index its remaining desktop-crawled sites with only its smartphone crawler (Google Search Central, June 2024). Sites not accessible at all on a mobile device would no longer be indexable.
Conclusion
Neither device has pushed the other off the web. Phones bring the larger share of traffic in several of the sources above, while desktops still show longer sessions and higher conversion rates in benchmark data. The exact split depends on who is counting and which month you look at. We’ll update this page as new data comes out.