
76 Screen Time Statistics for 2026
Screen time keeps climbing. Americans now spend more than 12 hours a day staring at screens. Kids under 9 average nearly 2.5 hours. And two-thirds of screen users report eye strain.
This page collects 76 screen time statistics from published research, government data, and industry reports, with a source link for every number.
Top Stats
- US adults will consume a record 13 hours and 26 minutes of media per day in 2026.
- Kenya leads with 63 hours and 34 minutes of weekly online media time.
- American teens aged 13–18 average 8 hours and 39 minutes of screen media per day.
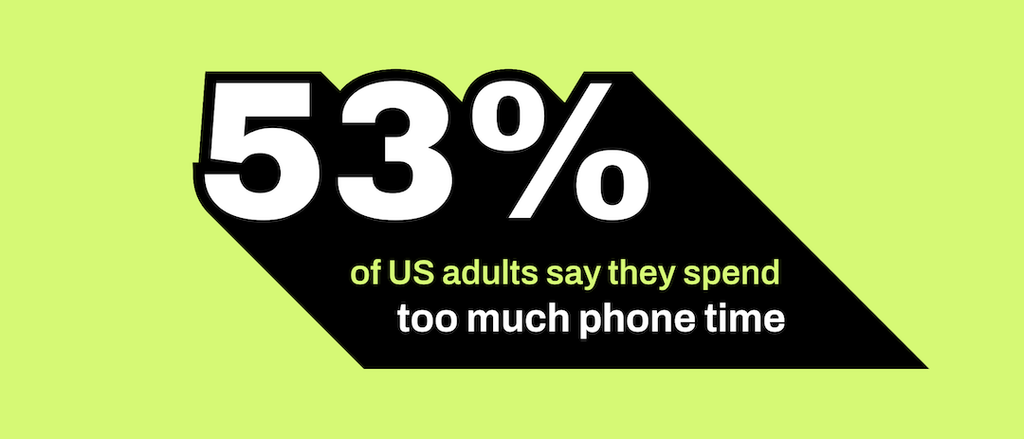
- 53% of US adults say they spend too much time on their phone.
- Streaming captured 44.8% of all US television viewing in May 2025.
- An estimated 66% of screen users experience computer vision syndrome.
- Among the heaviest 20% of notification recipients, employees are interrupted every 2 minutes during the workday.
How Much Screen Time Do People Get?
The average American is exposed to media for more than half the day. Here are the latest figures on overall screen time.
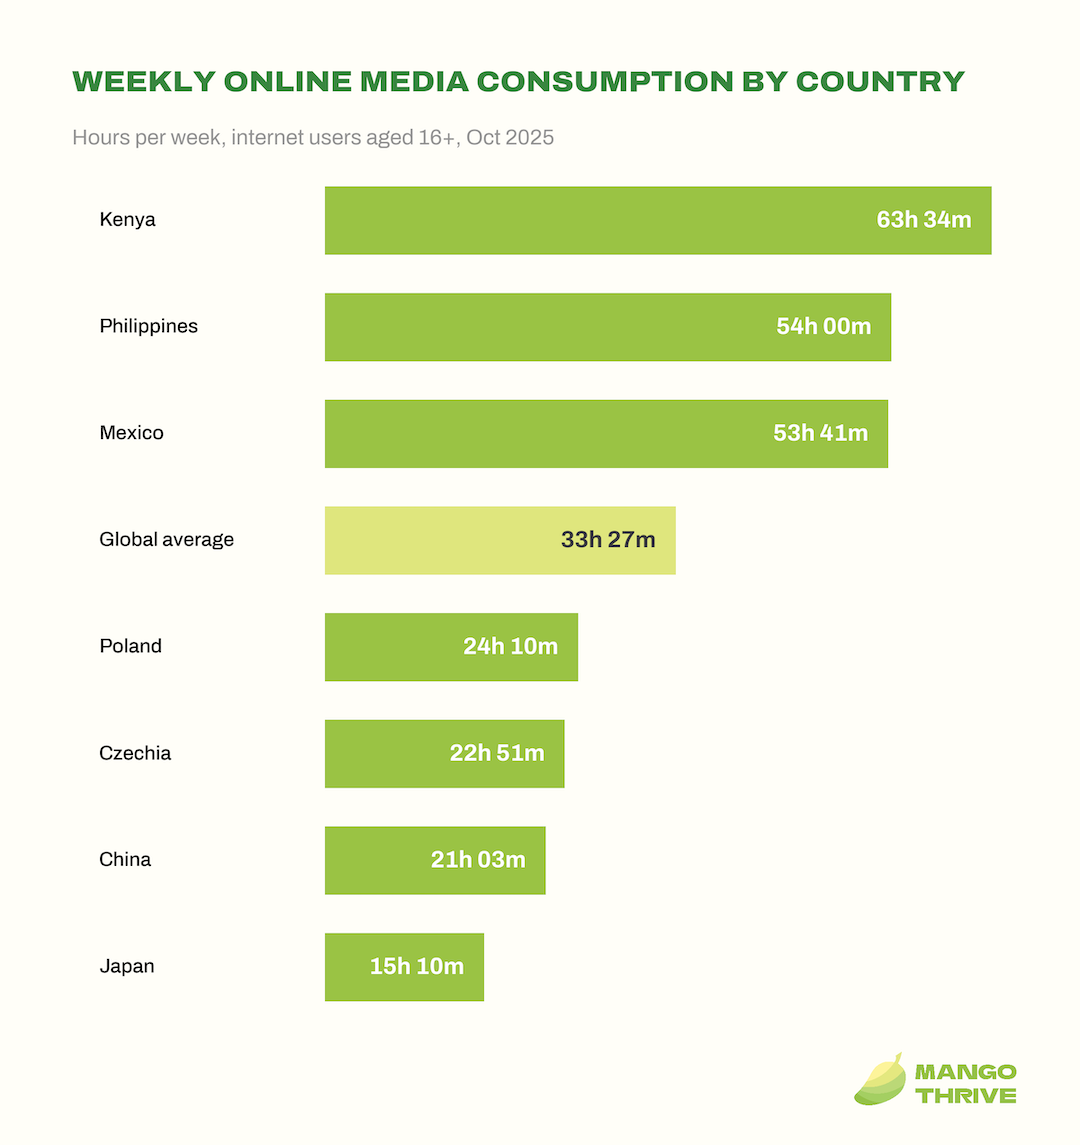
1. US adults will spend a record 13 hours and 26 minutes per day consuming media in 2026, according to eMarketer’s revised forecast (eMarketer).
2. The average US adult spent 8.6 hours per day with digital media in 2025, nearly double the level recorded in 2016 (eMarketer).
3. US adults are forecast to spend 2 hours and 14 minutes per day watching traditional (linear) TV in 2026, the final year it will be the leading single media activity (eMarketer).
4. Americans aged 15 and over spent an average of 2.6 hours per day watching television in 2025, accounting for half of all leisure time (Bureau of Labor Statistics).
5. Americans spent 37 minutes per day playing games or using a computer for leisure in 2025, up from 25 minutes a decade earlier (Bureau of Labor Statistics).
6. Americans aged 75 and older spent 4.43 hours per day watching television in 2025, the most of any age group (Bureau of Labor Statistics).
7. 53% of US adults say they spend too much time on their smartphone, according to a June 2026 Pew Research Center survey (Pew Research Center).
8. About one in four US adults say they use their smartphones almost constantly, with the rate rising to 42% among adults under 30 (Pew Research Center).
9. 41% of US adults say they are online almost constantly, with 90% going online at least daily (Pew Research Center).
10. Americans average 12 hours and 1 minute of daily screen time across all devices, with smartphones alone accounting for 4 hours and 5 minutes, according to a Reviews.org survey of 1,000 adults (Reviews.org).
11. Global weekly media consumption is forecast to decline 0.3% to 57 hours per week in 2025, the first drop since the Great Recession, while US consumption is projected to fall 1.8% to 79.6 hours per week (PQ Media via MediaPost).
Screen Time by Country
Online media consumption varies widely around the world. The gap between the highest and lowest countries is more than 48 hours per week.
12. Globally, the typical internet user spends about 33 hours and 27 minutes per week consuming online media, according to GWI survey data compiled by DataReportal (GWI via DataReportal).
13. Kenya logs the highest weekly online media consumption at 63 hours and 34 minutes, according to GWI data compiled by DataReportal (GWI via DataReportal).
14. The Philippines ranks second at 54 hours per week, followed by Mexico at 53 hours and 41 minutes (GWI via DataReportal).
Source: GWI via DataReportal, Oct 2025. Internet users aged 16+.
15. Japan has the lowest weekly online media consumption at 15 hours and 10 minutes, less than a quarter of Kenya’s total (GWI via DataReportal).
16. China, Czechia, and Poland round out the lowest four countries at roughly 21 to 24 hours per week (GWI via DataReportal).
Screen Time by Device and Platform
Mobile apps now dominate. Social media alone accounts for over 60% of the time people spend on their phones.
17. Mobile users worldwide spent a combined 5.3 trillion hours in iOS and Google Play apps in 2025, up 3.8% year over year (Sensor Tower).
18. The average mobile user spent 3.6 hours per day in apps across 80 markets in 2025, or more than 13 minutes of every waking hour (Sensor Tower).
19. Social media apps accounted for more than 60% of all mobile app time in 2025, totaling nearly 2.5 trillion hours, or over 90 minutes per day for the average user (Sensor Tower).
20. Time spent in generative AI apps reached 48 billion hours globally in 2025, roughly 3.6 times the 2024 total (Sensor Tower).
21. In March 2025, US TikTok users averaged 75 minutes per day in the app, second only to YouTube at 78 minutes per day (Sensor Tower).
22. UK adults spent an average of 4 hours and 30 minutes per day online for personal use across smartphones, tablets, and computers in May 2025, up 10 minutes from 2024 (Ofcom).
23. Smartphones accounted for 77% of all personal online time among UK adults in May 2025 (Ofcom).
24. Services owned by Alphabet and Meta accounted for 51% of all personal online time among UK adults in May 2025, with Meta at 1 hour 10 minutes per day and Alphabet at 1 hour 7 minutes (Ofcom).
25. UK adults averaged 51 minutes per day on YouTube (excluding TV screens) in May 2025, up from 47 minutes in 2024 (Ofcom).
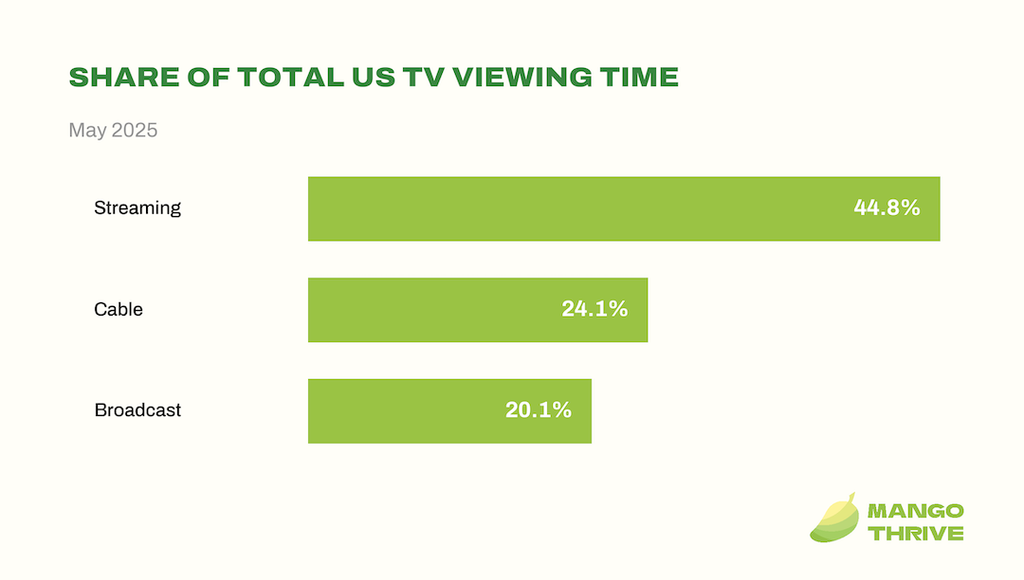
26. Streaming captured 44.8% of total US television viewing in May 2025, ahead of broadcast (20.1%) and cable (24.1%), with YouTube alone accounting for 12.5% (Nielsen).
Source: Nielsen, The Gauge, May 2025. First time streaming eclipsed combined broadcast and cable.
27. Social media video makes up 70–80% of all mobile video traffic on smartphones across four European networks sampled by Ericsson, while traditional streaming accounts for less than 10% (Ericsson).
28. US adults spent more than 8.5 hours per day with digital media in 2025, with mobile devices accounting for 48.6% of that time (eMarketer via TheDesk).
Children and Teen Screen Time
Children are spending more time on screens than ever. The youngest are not exempt: even toddlers now average more than an hour a day.
How Much Screen Time Do Kids Get?
29. Half of US teenagers aged 12 to 17 (50.4%) spend four or more hours a day on screens outside of schoolwork (CDC / NCHS).
30. American teens aged 13 to 18 average 8 hours and 39 minutes of screen-based media use per day, while tweens aged 8 to 12 average 5 hours and 33 minutes (Common Sense Media).
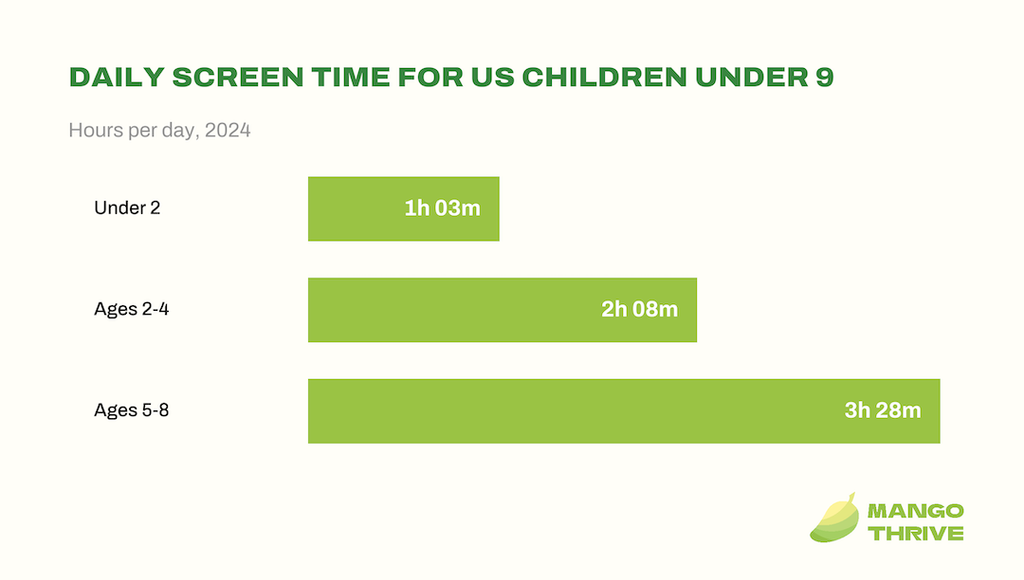
31. Children under 9 in the US spend an average of 2 hours and 27 minutes a day on screens, rising to 3 hours and 28 minutes for those aged 5 to 8 (Common Sense Media).
Source: Common Sense Media, 2025 Census. Survey of 1,578 parents, Aug 2024.
32. Daily gaming time among US children aged 0 to 8 jumped 65% in four years, from 23 minutes in 2020 to 38 minutes in 2024 (Common Sense Media).
33. Children from lower-income US households average 3 hours and 48 minutes of daily screen time, nearly double the 1 hour and 52 minutes in higher-income households (Common Sense Media).
What Platforms Do Teens Use?
34. YouTube is used by 90% of US teens, followed by TikTok and Instagram (60% each) and Snapchat (55%) (Pew Research Center).
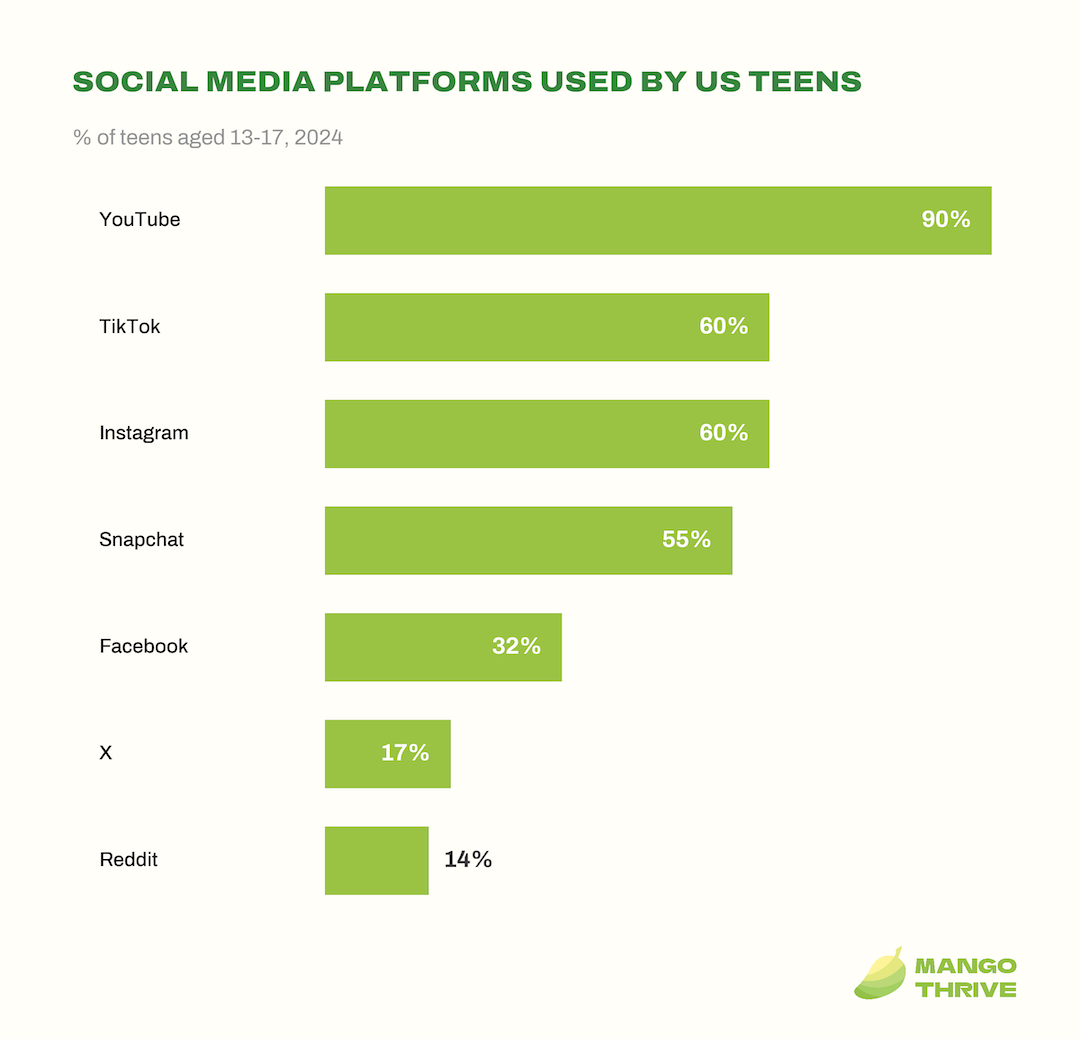
Source: Pew Research Center, Dec 2024. Survey of 1,391 teens aged 13–17, Sep–Oct 2024.
35. 46% of US teens say they are online “almost constantly,” nearly double the 24% who said the same a decade ago (Pew Research Center).
36. About four in ten US teens (38%) say they spend too much time on their phone (Pew Research Center).
37. Approximately three-quarters of US high school students report using social media at least several times a day (CDC).
Kids and YouTube
38. UK children aged 4 to 15 spend an average of 8 hours and 45 minutes per week watching video-sharing platforms, with YouTube alone accounting for 7 hours and 7 minutes (Ofcom).
39. More than a third (37%) of UK children aged 8 to 17 say they spend too much time on screens, rising to 44% among 16- and 17-year-olds (Ofcom).
40. The WHO recommends no sedentary screen time for children under 2 years old, and no more than one hour a day for children aged 2 to 4 (WHO).
41. 85% of US children aged 12 and under watch YouTube, and 51% watch it daily, with use among children under 2 climbing from 45% in 2020 to 62% in 2025 (Pew Research Center).
42. More than half (51%) of US children aged 8 and under now own a mobile device, with 40% of 2-year-olds already having their own tablet (Common Sense Media).
43. Among US teens, 60.4% of Black non-Hispanic adolescents report four or more hours of daily screen time, compared with 52.8% of Hispanic and 47.9% of White non-Hispanic peers (CDC / NCHS).
Screen Time by Gender and Demographics
Gender differences in screen time are consistent across age groups and countries.
44. In the UK, women spend an average of 4 hours and 43 minutes online per day, 26 minutes more than men (Ofcom).
45. Among UK adults aged 65 and over, women spend 17% more time online than men, the widest gender gap of any age group (Ofcom).
46. Smartphones account for 79% of women’s online time in the UK, compared with 75% for men (Ofcom).
47. Among 16- to 24-year-olds, women spend 25 hours and 45 minutes per week on social media and online video, compared with 23 hours and 36 minutes for men (GWI via DataReportal).
48. Women aged 16 to 24 spend roughly 3 hours per day on social media, compared with about 2 hours and 35 minutes for men of the same age, according to GWI data (GWI via DataReportal).
49. In the US, 44% of teen girls say they spend too much time on their smartphone, compared with 33% of teen boys (Pew Research Center).
50. Among US tweens, boys average 6 hours and 11 minutes of daily entertainment screen time compared with 4 hours and 55 minutes for girls, a gap of 1 hour and 16 minutes (Common Sense Media).
Health Effects of Screen Time
Excessive screen time is linked to higher rates of depression, anxiety, sleep disruption, obesity, and vision problems. The evidence is strongest for adolescents.
Screen Time and Mental Health
51. Adolescents who spent more than 3 hours per day on social media faced double the risk of poor mental health outcomes, including depression and anxiety symptoms, in a cohort of 6,595 US 12- to 15-year-olds (U.S. Surgeon General’s Advisory).
52. US teens who used screens 4 or more hours per day for non-school purposes were 2.5 times as likely to report depression symptoms, according to the 2021–2023 National Health Interview Survey (CDC).
53. The rollout of a social media platform across US colleges was associated with a 9% increase in depression and a 12% increase in anxiety over baseline rates, in a study spanning 359,827 observations (U.S. Surgeon General’s Advisory).
54. In the NIH ABCD Study of 9,538 US children aged 9–10, each additional hour of daily screen time was prospectively associated with increased depressive symptoms over two years (BMC Public Health).
55. Limiting social media use to 30 minutes per day for three weeks led to significant improvements in depression severity, with scores improving by more than 35% among those with high baseline depression (U.S. Surgeon General’s Advisory).
Screen Time and Sleep
56. Reading on a light-emitting screen for 4 hours before bed suppressed evening melatonin secretion by 55% and delayed the circadian clock by more than 1.5 hours compared with reading a printed book (Chang et al. 2014, PNAS).
57. A meta-analysis of 25 studies (4,562 participants aged 3–25) found that on days when youth used more screen time, they went to bed later (r = 0.079) (Browne et al. 2025, JAMA Pediatrics).
58. Only about 1 in 4 US high school students reported getting the recommended 8 or more hours of sleep in 2023, a rate that declined over the past decade (CDC YRBS).
Screen Time and Physical Health
59. A meta-analysis of 44 studies with 112,489 adolescents found that those in the highest screen time category were 27% more likely to be overweight or obese (OR = 1.27) (Fang et al. 2022, BMC Primary Care).
60. In the ABCD Study of 5,797 US adolescents aged 10–14, those with more than 8 hours of daily screen time were 29% more likely to be overweight or obese (RR = 1.29), and high physical activity did not offset that risk (Nagata et al. 2023).
61. Children who had 4 or more hours of daily screen time at age 1 were nearly 5 times as likely to have communication delays by age 2 (OR = 4.78), in a Japanese cohort of 7,097 pairs (Takahashi et al. 2023, JAMA Pediatrics).
Screen Time and Vision
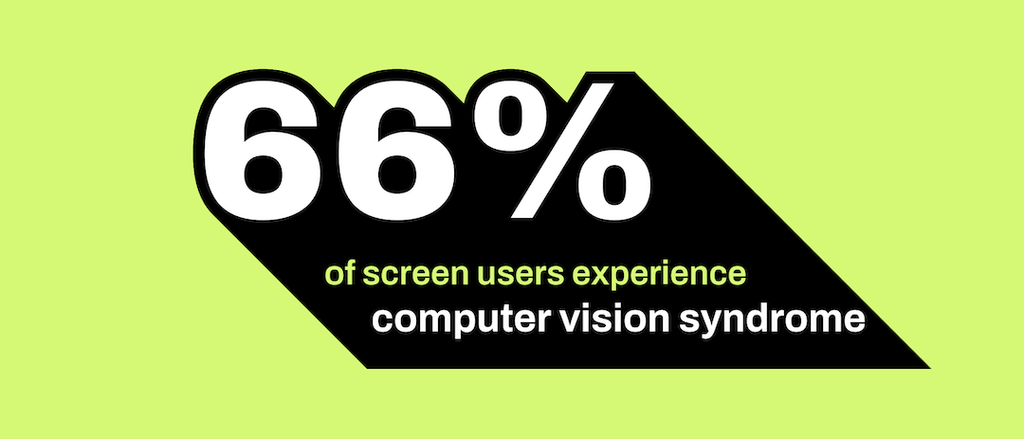
62. An estimated 66% of screen users experience computer vision syndrome (eye strain, dryness, and headaches), according to a meta-analysis of 45 studies across 20 countries (Abusamak et al. 2023, Scientific Reports).
63. By 2050, an estimated 4.76 billion people, nearly half the world’s population, will have myopia, with high myopia projected to affect 938 million, a fivefold increase from 2000 (Holden et al. 2016, Ophthalmology).
How Many Kids Meet Screen Time Guidelines?
64. Only about 1 in 4 children under age 2 (24.7%) and roughly 1 in 3 children aged 2–5 (35.6%) meet the WHO screen time guidelines (McArthur et al. 2022, JAMA Pediatrics).
65. Nearly 1 in 3 US adolescents report using screens until midnight or later on school nights, and a review of 42 studies found a consistent link between social media use and poor sleep quality (U.S. Surgeon General’s Advisory).
Screen Time at Work
Digital overload at work is a growing concern. Constant notifications and meetings leave workers drained.
66. Among the top 20% of workers by notification volume, employees are interrupted by a meeting, email, or ping every 2 minutes during the workday (Microsoft).
67. The average knowledge worker receives 117 emails per day (Microsoft).
68. 80% of the global workforce say they lack the time or energy to do their job (Microsoft).
69. 35% of employed Americans did some or all of their work at home on days they worked in 2025 (Bureau of Labor Statistics).
70. 75% of US workers whose jobs can be done remotely are working from home at least some of the time (Pew Research Center).
71. A 2024 study tracking 125 workers over 10 days found video meetings were not more exhausting than in-person meetings, and video meetings under 44 minutes were actually less exhausting than other meetings (Nesher Shoshan & Wehrt, Johannes Gutenberg University Mainz).
Managing Screen Time
Many people know they use their phone too much. Cutting back is harder than it sounds.
72. 45% of US adults tried to reduce their smartphone use in the past year, but only 25% of those who tried said they were extremely or very successful (Pew Research Center).
73. 41% of US adults say their smartphone has a negative impact on their sleep (Pew Research Center).
74. 70% of Irish consumers say they spend too much time on their phones, rising to 78% among millennials (Deloitte Ireland).
75. 24% of Irish smartphone owners have set screen time limits on their phone in the past year (Deloitte Ireland).
76. UK adults aged 18–24 spend 6 hours and 20 minutes online per day, nearly double the 3 hours and 20 minutes logged by those aged 65 and older (Ofcom).
Conclusion
Overall screen time has kept climbing for years, and in 2025, global media consumption was forecast to see its first dip since the Great Recession, suggesting we may be approaching a ceiling. The health evidence is clearest for adolescents, where hours on screens track with higher rates of depression, poor sleep, and obesity. Meanwhile, most adults who try to cut back say they don’t fully succeed at it.
These numbers will shift as AI apps, streaming, and remote work continue to reshape how people spend their time. We will update this page as new data comes in.