A startup can be a one-person side business or a venture-backed AI lab. Both show up in startup data. This page covers how many startups launch, how many survive, how they raise money and who founds them. Here are the latest startup statistics.
Top Startup Statistics
- 5.67 million business applications were filed in the US in 2025 (U.S. Census Bureau, Business Formation Statistics data).
- $510 billion in global venture funding was invested in H1 2026, a record half-year (Crunchbase News, H1 2026 funding).
- 51.4% of US private-sector establishments opened in the year to March 2020 survived five years (BLS Business Employment Dynamics, Table 7).
- 1.3% of US startups founded in 2018 on Carta were private unicorns as of January 2025 (Carta, 2018 startup cohort).
- More than 70% of global startup capital in Q2 2026 went to AI-focused companies (Crunchbase News, H1 2026 funding).
- 195 companies became unicorns worldwide in H1 2026, per Crunchbase (Crunchbase News, H1 2026 unicorns).
- 36.3% of new US startups on Carta had a solo founder in H1 2025, up from 23.7% in 2019 (Carta, Solo Founders Report).
- 3.5 million jobs came from US private-sector establishments less than 1 year old in the year to March 2025 (BLS Business Employment Dynamics, Table 1).
How Many Startups Are Launched Each Year?
These Census Bureau figures count applications for a federal tax ID.
1. 5.67 million business applications were filed in the US in 2025 (U.S. Census Bureau, Business Formation Statistics data). The count is based on applications for an Employer Identification Number, a federal tax ID.
In the Census Bureau’s data, “high-propensity business applications” means applications with a high likelihood of becoming businesses with payroll.
2. 1.71 million of those 2025 US business applications were classed as high-propensity (U.S. Census Bureau, Business Formation Statistics data).
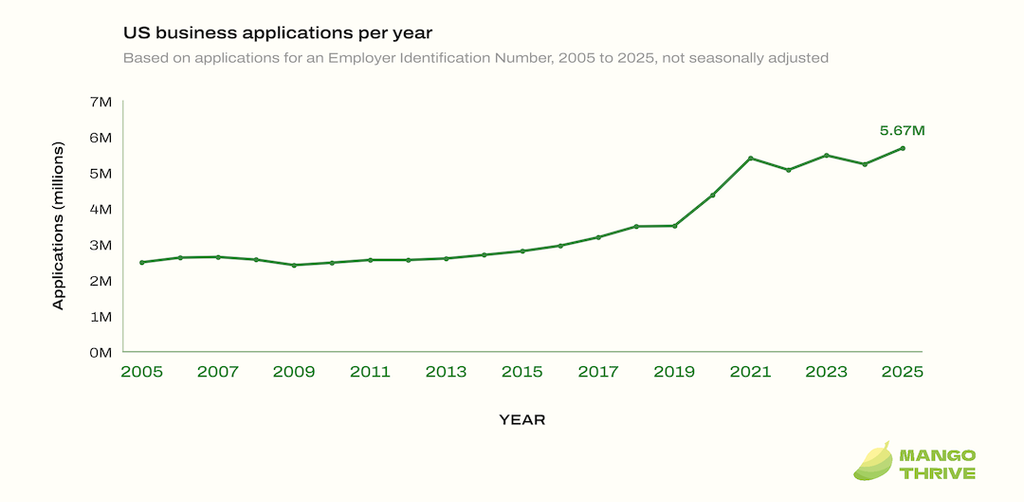
US business applications per year, 2005 to 2025
Source: U.S. Census Bureau, Business Formation Statistics data. Each year is the sum of monthly figures that are not seasonally adjusted.
New Business Formation in the US
These figures track new US businesses through tax ID applications, new business locations and new owners. An establishment is a single business location, and an employer business is one with paid employees.
3. 4.35 million US business applications were filed from January to August 2026, not seasonally adjusted (U.S. Census Bureau, Business Formation Statistics data).
Seasonally adjusted figures remove the normal ups and downs of the calendar.
4. 531,728 US business applications were filed in August 2026, seasonally adjusted (U.S. Census Bureau, August 2026 release). That was 7.8% fewer than in July 2026.
In the Census Bureau’s data, “projected business formations” means the projected number of employer businesses arising from a month’s applications within four quarters.
5. 28,501 new US employer businesses are projected to form from August 2026 applications within four quarters, seasonally adjusted (U.S. Census Bureau, August 2026 release).
In the Census Bureau’s BDS, an “establishment opening” means an establishment with employees this year and none the year before.
6. 790,295 new US business establishments opened in 2023, an entry rate of 10.6% (U.S. Census Bureau BDS, economy-wide).
In BLS Business Employment Dynamics, an establishment “birth” is a location reporting employees for the first time, or again after a full year with none.
7. 338,000 private-sector establishments were born in the US in Q4 2025 (BLS, Business Employment Dynamics Q4 2025). They accounted for 1,006,000 jobs.
In Kauffman’s data, the “rate of new entrepreneurs” means the share of adults not already owning a business who start one each month. New owners must work at least 15 hours a week in the business, which can be incorporated or not.
8. 360 out of every 100,000 US adults became new entrepreneurs in an average month of 2025 (Kauffman Foundation). The rate, 0.36%, increased in 2025 and stayed above pre-pandemic levels.
In Kauffman’s data, “opportunity share” means the percentage of new entrepreneurs who started businesses out of opportunity instead of necessity.
9. 83.3% of new US entrepreneurs started out of opportunity rather than necessity in 2025 (Kauffman Foundation). The share was up from 69.8% in 2020 but below 86.9% in 2019.
Startup Activity Around the World
These figures compare new business activity across countries.
In GEM, “Total early-stage Entrepreneurial Activity (TEA)” means the share of adults aged 18–64 starting or running a new business.
10. 17.7% of US adults were starting or running a new business in 2025 (GEM 2025/2026 Global Report). The share was 19.3% in 2024.
11. 27.4% of adults in Canada were starting or running a new business in 2025 (GEM 2025/2026 Global Report).
12. 21.9% of UK adults were starting or running a new business in 2025, up from 14.2% in 2024 (GEM 2025/2026 Global Report).
13. 52.9% of adults in Angola were starting or running a new business in 2025, the highest among GEM economies (GEM 2025/2026 Global Report).
14. Six GEM-participating economies had one in four or more adults starting or running a new business in 2025 (GEM 2025/2026 Global Report). They were Angola, Ecuador, Chile, Saudi Arabia, Canada and Guatemala.
15. 3.5 million new enterprises were born in the EU in 2024, a 10.4% birth rate (Eurostat). They created 3.7 million jobs.
16. EU enterprise birth rates ranged from 6.3% in Austria to 17.5% in Lithuania in 2024 (Eurostat).
17. 317,000 businesses were born in the UK in 2024, a birth rate of 11.1% (ONS).
18. Over 223,000 startups had been recognized by India’s government as of March 31, 2026 (PIB).
19. More than 55,200 startups were recognized in India in fiscal 2025-26, the most in any single year since Startup India launched (PIB).
What Percentage of Startups Survive?
The BLS figures below track new business locations, called establishments, rather than companies. The Carta cohort figures follow US startups that sought venture capital. For more on closures, see our startup failure statistics.
20. 77.9% of US private-sector establishments opened in the year to March 2024 survived one year (BLS Business Employment Dynamics, Table 7).
21. 51.4% of US private-sector establishments opened in the year to March 2020 survived five years (BLS Business Employment Dynamics, Table 7).
22. 34.7% of US private-sector establishments opened in the year to March 2015 survived 10 years (BLS Business Employment Dynamics, Table 7).
23. 56.4% of 4,369 US startups founded in 2018 and tracked by Carta raised a seed round by January 2025 (Carta, 2018 startup cohort). The group covers startups that sought venture capital; 36.4% went on to raise a Series A.
24. 14.8% of the 2018 US startup cohort on Carta reached Series B within six years (Carta, 2018 startup cohort). Only 4.4% reached Series C and 1.1% Series D or beyond.
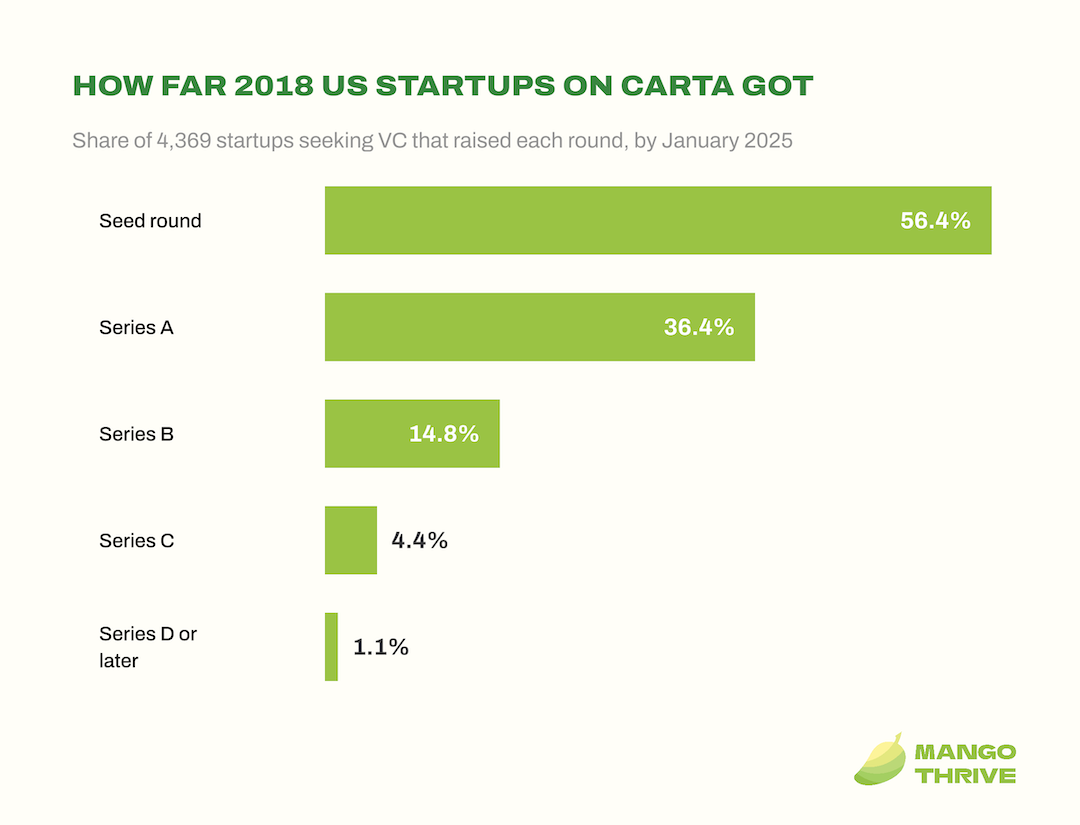
Share of US startups founded in 2018 on Carta that sought venture capital and raised each funding round by January 2025
Source: Carta, 2018 startup cohort.
25. 1.3% of US startups founded in 2018 on Carta were private unicorns as of January 2025 (Carta, 2018 startup cohort). Another 5.5% had been acquired and 0.34% had gone public.
26. 70% of failed VC-backed startups analyzed by CB Insights ran out of capital (CB Insights). The analysis covered 385 companies that shut down since 2023; startups could cite several reasons.
27. 966 US startups on Carta shut down in 2024, up from 769 in 2023 (Carta via TechCrunch).
Global Startup Funding Statistics
These figures cover startup funding worldwide, plus the money raised by venture funds.
In Crunchbase data, “seed and angel” covers pre-seed, seed and angel rounds, “early-stage” covers Series A and B, and “late-stage” covers Series C and later. Venture rounds of unknown series are sorted by size: $3 million or less, above $3 million to $15 million, and above $15 million.
28. $510 billion in global venture funding was invested in H1 2026, a record half-year (Crunchbase News, H1 2026 funding).
29. $440 billion was invested in startups globally in 2025, per Crunchbase data as of July 2026 (Crunchbase News, H1 2026 funding).
30. $205 billion went to more than 5,000 startups globally in Q2 2026 (Crunchbase News, H1 2026 funding). Investors had put $305 billion into startups in Q1 2026.
31. 53% of global venture funding in Q2 2026 came from billion-dollar rounds raised by 16 companies (Crunchbase News, H1 2026 funding). Those rounds totaled $108.6 billion.
32. Two-thirds of global startup capital in Q2 2026 went to US-based companies (Crunchbase News, H1 2026 funding). That was down from 83% in Q1 2026.
33. $134 billion in global late-stage venture funding was raised in Q2 2026 (Crunchbase News, H1 2026 funding). That was up 141% from Q2 2025 but down from Q1 2026.
34. $58.9 billion in global early-stage funding was raised in Q2 2026, up more than 100% from a year earlier (Crunchbase News, H1 2026 funding).
35. $12 billion in global seed funding was raised in Q2 2026 (Crunchbase News, H1 2026 funding). Of that, $2.8 billion went to seed rounds of $100 million or more.
36. $145.9 billion was raised by VC funds globally in 2025, a decade low (KPMG Venture Pulse Q2 2026).
US Venture Capital Statistics
These figures cover venture capital in the US.
37. $412.7 billion in US venture capital deal value was recorded in H1 2026 (PitchBook-NVCA Venture Monitor). That half-year total already exceeded full-year 2025.
38. 87.5% of US venture deal value in H1 2026 came from rounds of $100 million or more (PitchBook-NVCA Venture Monitor). Deals under $100 million drew $51.4 billion.
39. $319.2 billion in US venture capital deal value was recorded in 2025 (PitchBook-NVCA Venture Monitor). The 2021 total was $358.6 billion.
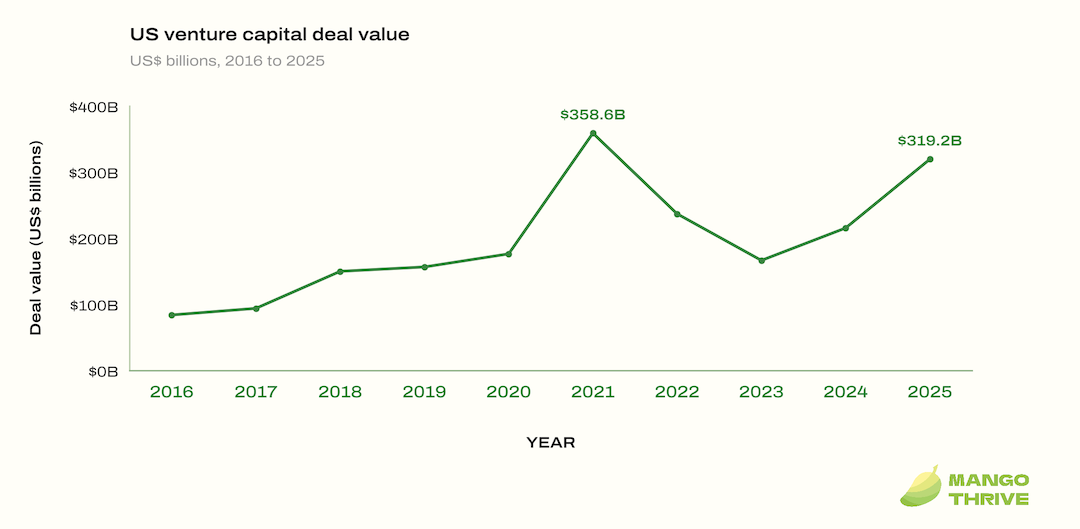
US venture capital deal value, 2016 to 2025
Source: PitchBook-NVCA Venture Monitor, p. 8.
40. 16,348 US venture capital deals were made in 2025, by PitchBook’s estimate (PitchBook-NVCA Venture Monitor). PitchBook counted 19,699 deals in 2021, and its H1 2026 estimate was 9,646.
41. 5,674 US companies raised their first venture round in H1 2026, by PitchBook’s estimate (PitchBook-NVCA Venture Monitor).
42. $72.4 billion was raised by US venture funds across 405 funds in H1 2026 (PitchBook-NVCA Venture Monitor). Full-year 2025 fundraising was $74.9 billion.
43. $3.4 billion was raised by first-time US venture funds across 53 vehicles in H1 2026 (PitchBook-NVCA Venture Monitor). First-time funds raised $11.4 billion in all of 2025.
AI Startup Statistics
These figures cover AI startups: funding, deals, valuations and new companies.
44. Roughly 50% of global venture funding in 2025 went to AI-related companies, per Crunchbase data as of January 2026 (Crunchbase News, 2025 funding).
45. More than 70% of global startup capital in Q2 2026 went to AI-focused companies (Crunchbase News, H1 2026 funding).
46. $217 billion, or 43% of all global startup funding in H1 2026, went to OpenAI and Anthropic (Crunchbase News, H1 2026 funding).
47. 86% of US venture dollars in H1 2026 went to AI, a total of $355.9 billion (PitchBook-NVCA Venture Monitor).
48. 43.2% of US VC deals in H1 2026 were AI deals (PitchBook-NVCA Venture Monitor).
49. 65.5% of US VC deal value went to AI companies in 2025 (PitchBook-NVCA Venture Monitor).
50. $209.0 billion was invested across 6,827 US AI venture deals in 2025 (PitchBook-NVCA Venture Monitor).
51. $83.0 million was the median US AI Series A pre-money valuation in H1 2026, versus $44.0 million for non-AI (PitchBook-NVCA Venture Monitor).
In the Stanford AI Index, “private investment” covers AI and machine learning companies that have raised over $1.5 million since 2013.
52. $344.7 billion in global private investment went to AI in 2025, up 127.5% from 2024 (Stanford HAI AI Index 2026).
53. $170.9 billion of global private AI investment in 2025 went to generative AI companies (Stanford HAI AI Index 2026). That was nearly half of all private AI investment.
54. 3,499 newly funded AI companies were counted worldwide in 2025, up 70.8% from 2024 (Stanford HAI AI Index 2026).
55. 1,953 newly funded AI companies were US-based in 2025, versus 172 in the UK and 161 in China (Stanford HAI AI Index 2026).
56. Nearly $285.9 billion in private AI investment went to US companies in 2025, versus $12.4 billion in China (Stanford HAI AI Index 2026).
57. 60.7% of capital invested in US startups on Carta in Q1 2026 went to AI companies (Carta, State of Private Markets Q1 2026). That share was 56.8% in 2025.
58. $4.09 billion was the median US AI Series E+ post-money valuation on Carta in 2025, versus $616 million for non-AI (Carta, State of Private Markets 2025).
59. Roughly a third of US rounds at each stage from Series A to E+ on Carta in 2025 were AI (Carta, State of Private Markets 2025).
Startup Valuation Statistics
A pre-money valuation is what a startup is worth just before new money comes in. A down round is raised at a lower valuation than the last one, and an up round at a higher one. PitchBook and Carta use different data sets.
60. Median US pre-money valuations passed their 2021 highs at every series in H1 2026 (PitchBook-NVCA Venture Monitor). At pre-seed, seed and Series D+, they more than doubled versus 2021.
61. $2.03 billion was the median US Series D+ pre-money valuation in H1 2026 (PitchBook-NVCA Venture Monitor). That was more than double the 2025 level of $850.0 million.
62. 11.4% of rounds on Carta in Q1 2026 were down rounds, the lowest in nearly four years (Carta, State of Private Markets Q1 2026).
63. 96.1% of capital raised on Carta in Q1 2026 went to up rounds (Carta, State of Private Markets Q1 2026). That was the highest share since 2021.
64. Seed pre-money valuations fell 6.6% year over year on Carta in Q1 2026 (Carta, State of Private Markets Q1 2026). Series A pre-money valuations fell 7.1%.
65. Series B primary pre-money valuations rose 17.2% year over year on Carta in Q1 2026 (Carta, State of Private Markets Q1 2026). Series C valuations rose 12.5%.
66. Two years is the typical gap between seed and Series A rounds on Carta in Q1 2026 (Carta, State of Private Markets Q1 2026). The median gap from Series A to Series B was 2.1 years.
How Many Unicorns Are There?
A unicorn is a private startup valued at a billion dollars or more. Each source counts unicorns by its own rules.
In Hurun’s Global Unicorn Index 2026, a “unicorn” means a private company founded after 2000 and worth $1 billion or more.
67. 1,603 unicorns existed worldwide in Hurun’s 2026 index, a record high, up 80 in a year (Hurun Research Institute).
68. 806 unicorns, 50.3% of the global total, were based in the US in Hurun’s 2026 index (Hurun Research Institute). China had 381, the UK 70 and India 61.
69. 222 unicorns were based in San Francisco, the most of any city in Hurun’s 2026 index (Hurun Research Institute). New York had 141, Beijing 86 and London 60.
70. 112 unicorns were based in EU countries in Hurun’s 2026 index, led by Germany with 31 (Hurun Research Institute). France followed with 29.
In Crunchbase, a “unicorn” means a private company with a post-money valuation of $1 billion or more.
71. 195 companies became unicorns worldwide in H1 2026, per Crunchbase (Crunchbase News, H1 2026 unicorns). That already topped the 193 new unicorns minted in all of 2025.
72. 110 of H1 2026’s new unicorns were US companies, 56% of the total (Crunchbase News, H1 2026 unicorns). China followed with 38 and the U.K. with 13.
73. 82 private companies on the Crunchbase Unicorn Board were valued at $10 billion or more in December 2025 (Crunchbase News, 2025 unicorns). That was up from 70 at the end of 2024.
74. 46% of the 953 unicorns that joined Crunchbase’s Unicorn Board before 2021 had exited by mid-2025 (Crunchbase News, unicorn backlog).
75. Over 60% of unicorns on Crunchbase’s Unicorn Board had not raised funding with a disclosed value in more than three years (Crunchbase News, unicorn backlog). The figure is as of June 2025.
Startup Exit and IPO Statistics
An exit is when a startup’s investors cash out, such as through a stock market listing (IPO) or an acquisition. Renaissance Capital’s IPO counts are not limited to startups.
In PitchBook’s data, “IPO value” means the company’s pre-money valuation at its IPO price.
76. $2.19 trillion in US VC-backed exit value was recorded in H1 2026 (PitchBook-NVCA Venture Monitor). Full-year 2025 exit value was $284.1 billion.
77. SpaceX’s IPO, valued at $1.7 trillion in Q2 2026, was the largest IPO of all time (PitchBook-NVCA Venture Monitor). The listing raised $75 billion.
78. $250 billion: SpaceX’s Q1 2026 acquisition of xAI was the largest acquisition of a VC-backed company ever (PitchBook-NVCA Venture Monitor).
79. $375.4 billion in US VC-backed acquisition value in H1 2026 was a decade high (PitchBook-NVCA Venture Monitor).
A SPAC is a listed shell company set up to buy a private company.
80. 202 US IPOs raised a combined $44.0 billion in 2025, a four-year high (Renaissance Capital). Counts include IPOs and direct listings with a market cap of at least $50 million, excluding SPACs and closed-end funds.
81. 71 US IPOs raised $100 million or more in 2025 (Renaissance Capital). That was below historical averages.
82. 41% of all startup exits in 2025 were in North America, worth 49% of global exit value (Startup Genome, GSER 2026).
83. 37% of global startup exits in 2025 were in Europe, but only 11% of exit value (Startup Genome, GSER 2026). Asia had 12% of exits and 30% of exit value.
Startup Founder Statistics
These figures cover who starts companies, how much of the company founders keep and how much venture money female founders raise.
In Azoulay et al., a “1-in-1,000 fastest growing” startup means one in the top 0.1% for employment growth five years after founding.
84. The mean founder age of the fastest-growing US startups was 45.0 (firms founded 2007–2009) (Azoulay et al., American Economic Review: Insights). The figure covers the top 1 in 1,000 new ventures by growth.
85. The average US founder was 41.9 years old at founding, across 2007–2014 startups (NBER Working Paper 24489). The data covers 2.7 million founders of companies that went on to hire at least one employee.
86. A 50-year-old founder was 1.8 times more likely than a 30-year-old to build a top-growth startup (NBER Working Paper 24489). The comparison uses US firms founded from 2007 to 2009.
87. 0.28% of US women became new entrepreneurs each month in 2025, versus 0.44% of men (Kauffman, 2025 National Report (PDF)). The women’s rate was 0.23% in 2019.
88. Americans aged 35 to 54 started businesses at the highest monthly rate in 2025, 0.43% (Kauffman, 2025 National Report (PDF)). Adults aged 20 to 34 had the lowest rate, at 0.26%.
89. 36.3% of new US startups on Carta had a solo founder in H1 2025, up from 23.7% in 2019 (Carta, Solo Founders Report).
A priced round sets a price per share for the startup.
90. Solo-founder startups were 30% of Carta startups founded in 2024 but got 14.7% of priced-round cash (Carta, Solo Founders Report).
91. Founding teams kept 56.2% of equity (median) after a priced seed round, per Carta (Carta, Founder Ownership Report). The figures cover US-incorporated companies with venture rounds from 2020 to 2024.
92. Founding teams owned 36.1% of their startup (median) at Series A, in Carta’s 2020–2024 round data (Carta, Founder Ownership Report).
93. 45.9% of two-founder teams on Carta split equity equally in 2024 (Carta, Founder Ownership Report).
In PitchBook’s report, a “female-founded” company is a VC-backed company with at least one female founder.
94. US female-founded startups raised $73.6 billion in venture capital in 2025, a record (PitchBook, All In: Female Founders 2025). PitchBook’s female-founder data excludes OpenAI, and total deal count for the group declined.
95. Female-founded companies took 27.7% of US venture deal value in 2025, an all-time high (PitchBook, All In: Female Founders 2025). PitchBook’s shares exclude OpenAI and companies with undisclosed founder genders.
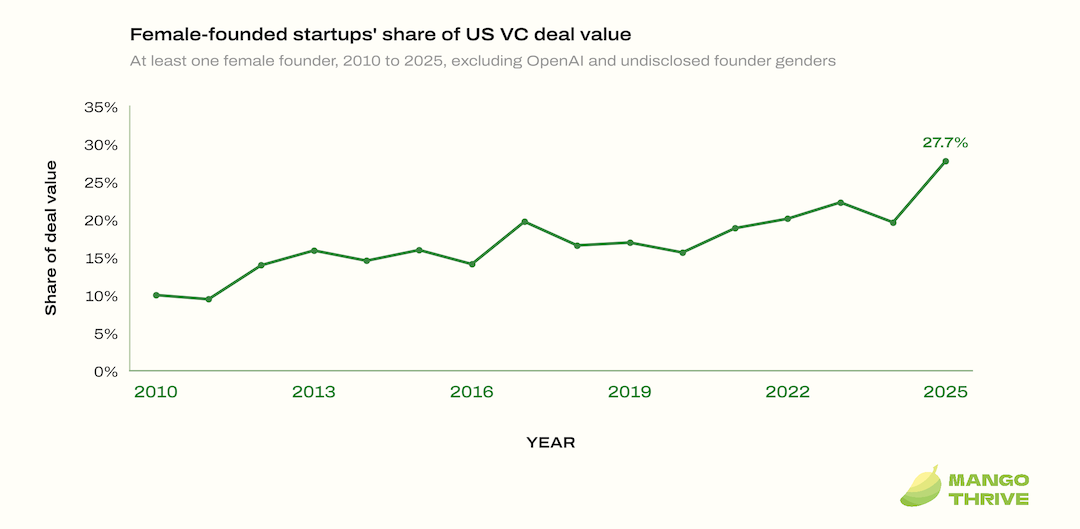
Female-founded startups’ share of US venture capital deal value, 2010 to 2025
Source: PitchBook, All In: Female Founders 2025, data pack.
96. 24.1% of US VC deals in 2025 went to female-founded companies, down from 25.7% in 2024 (PitchBook, All In: Female Founders 2025).
97. $3.2 billion in VC went to US startups with all-female founding teams across 797 deals in 2025 (PitchBook, All In: Female Founders 2025). The 2021 total was $7.4 billion across 1,234 deals.
98. Two-thirds of US VC dollars invested in female-founded startups in 2025 went to AI (PitchBook, All In: Female Founders 2025).
99. 24.9% of US VC-backed exits in 2025 were female-founded companies, by count (PitchBook, All In: Female Founders 2025).
100. 18.0% of decision-makers at US VC firms with $50 million or more in assets were women at the end of 2025 (PitchBook, All In: Female Founders 2025). Decision-makers are partners, principals and managing directors.
How Do New Businesses Find Funding?
These figures come from a Federal Reserve survey of US businesses with employees, called employer firms.
101. 29% of US employer firms aged 0–2 years received funds from their owners in the prior 12 months, per the 2025 survey (Federal Reserve Banks, Small Business Credit Survey data). 13% got loans from family or friends, and 5% got an equity investment.
102. 68% of US employer firms aged 0–2 years applied for financing in the prior 12 months, per the 2025 survey (Federal Reserve Banks, Small Business Credit Survey data). The share was 50% for firms 21 or more years old.
103. 48% of US employer firms aged 0–5 years seeking loans, credit lines or cash advances were fully approved in the 2025 survey (Federal Reserve Banks, Small Business Credit Survey report). Firms 21 or more years old had a 63% rate.
104. 55% of US employer firms aged 0–2 years were operating at a loss at the end of 2024 (Federal Reserve Banks, Small Business Credit Survey data). That compares with 24% of firms 21 or more years old.
How Many Jobs Do Startups Create?
These figures cover new business locations, jobs at new and existing firms, and headcount at US startups on Carta.
105. 3.5 million jobs came from US private-sector establishments less than 1 year old in the year to March 2025 (BLS Business Employment Dynamics, Table 1).
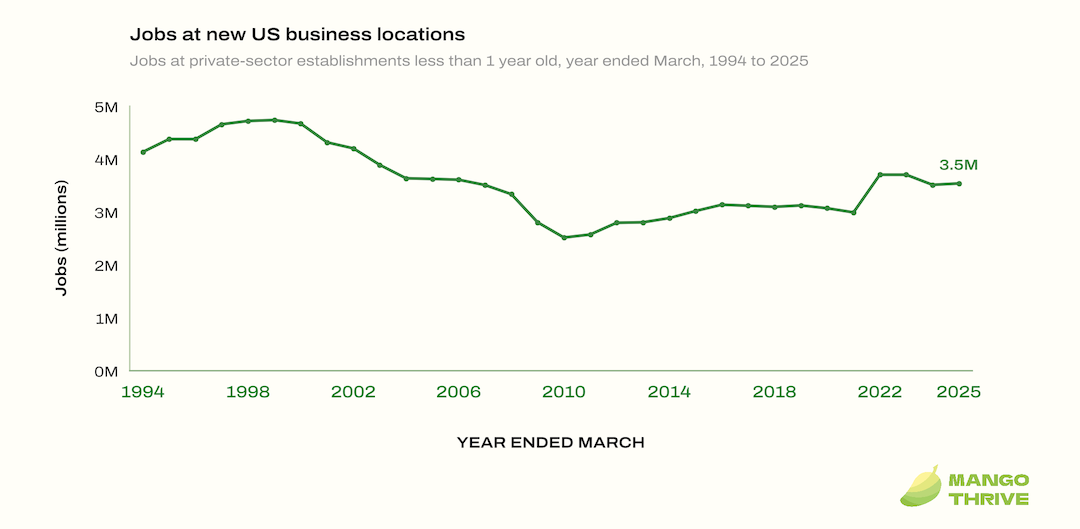
Jobs at US private-sector establishments less than 1 year old, 1994 to 2025
Source: BLS Business Employment Dynamics, Table 1. Years end in March.
106. 980,333 US private-sector establishments were less than 1 year old in March 2025 (BLS Business Employment Dynamics, Table 5). The total across all ages was 9,327,405.
In the Census Bureau’s BDS, a “new firm” (firm age of zero) is one whose establishments are all new that year.
107. 508,777 new US employer firms started in 2023, employing 2,440,753 people (U.S. Census Bureau BDS, by firm age).
108. 3,439,339 net new jobs came from US employer firms of all ages in 2023 (U.S. Census Bureau BDS, economy-wide).
109. 5.3 jobs per 1,000 people were created by US startups in their first year in 2025 (Kauffman Foundation). The level was unchanged from the previous year.
110. 5 people was the median headcount at US seed-stage startups on Carta as of February 2026 (Carta, startup headcount 2026). That was down from about 10 in 2021.
111. 17 people was the median headcount at US Series A startups on Carta as of February 2026 (Carta, startup headcount 2026). That was down from 26 in 2021.
112. 31,000 net jobs were added by US startups on Carta from the start of 2023, as of May 2025 (Carta, startup headcount 2025). From 2019 through 2022, they added 865,000.
Startup Ecosystems and Funding by Region
These figures compare startup hubs and funding across regions.
In Startup Genome’s 2026 report, “Ecosystem Value” means the value of exits and startup valuations from H2 2023 to 2025.
113. $10.9 trillion is the global startup Ecosystem Value in Startup Genome’s 2026 report (Startup Genome, GSER 2026 press release).
114. Over $3 trillion is Silicon Valley’s startup Ecosystem Value, nearly 3x the next largest ecosystem (Startup Genome, GSER 2026).
115. Silicon Valley, New York City and London rank as the top three startup ecosystems in 2026 (Startup Genome, 2026 ranking). All three held the same positions as the year before.
116. 64% of global late-stage startup funding goes to North America, per Startup Genome’s 2026 report, up from 56% in 2021 (Startup Genome, GSER 2026). Asia takes around 17% and Europe 16%.
117. $85.3 billion in VC went to European companies across 8,626 deals in 2025 (KPMG Venture Pulse Q4 2025). KPMG’s Europe figures include Israel.
118. More than $5.8 billion in VC went to Japanese startups in 2025 (KPMG Venture Pulse Q4 2025).
119. More than $3 billion in VC went to Brazilian startups in 2025, up from $1.8 billion (KPMG Venture Pulse Q4 2025).
120. CAD $8.0 billion in venture capital went to Canadian companies across 571 deals in 2025 (CVCA). Capital fell 6% and deal count 12% from 2024.
121. $3.2 billion was raised by African startups in 2025, up 40% from 2024 (Africa: The Big Deal, 2025 in review).
122. 82% of African startup funding in 2025 went to Egypt, Kenya, Nigeria and South Africa (Africa: The Big Deal, 2025 by country).
123. Almost $1 billion went to Kenyan startups in 2025, the most of any African country (Africa: The Big Deal, 2025 by country). Egypt followed with $614 million, South Africa $600 million and Nigeria $343 million.
124. $2.2 billion in early-stage VC went to Latin American startups in 2025, 52% of the total invested (LAVCA).
125. Mexico-based startups raised 21% more capital in 2025 than in 2024, trailing Brazil by 14% in total funding (LAVCA).
Conclusion
Starting a small business and building a venture-backed company are different paths, and the figures above cover both. AI now takes a large share of venture funding. Many new business locations close within their first few years. We’ll update this page as new data comes out.