
Startup failure is one of the most quoted and least sourced topics in business.
The scariest numbers repeated across the web trace back to no primary dataset at all, while the real answers sit in government survival tables and investor platform data that hardly anyone opens.
This page collects only statistics that can be traced to a primary source: official statistical agencies, investor platforms, and named research studies.
Here are 70 startup failure statistics that show what actually happens to new businesses.
Top Startup Failure Statistics
- 48.6% of US private-sector establishments opened in the year ending March 2020 had closed within five years (BLS Business Employment Dynamics)
- 22.1% of new US private-sector establishments opened in the year ending March 2024 had closed within their first year (BLS Business Employment Dynamics)
- Running out of capital was cited in 70% of failures among VC-backed startups that shut down since 2023 (CB Insights)
- The 431 VC-backed startups that shut down since 2023 had raised a combined $17.5 billion in equity funding before dying (CB Insights)
- 966 US startups on Carta shut down in 2024, up 25.6% from 2023 (Carta data via TechCrunch)
- Only about 17% of startups that raised seed rounds in 2022 reached Series A within two years on Carta (Carta, Seed to Series A Graduation Rate)
- Only 38.4% of UK businesses born in 2019 were still trading five years later (ONS, Business Demography UK 2024)
How Many Startups Fail?
1. 48.6% of US private-sector establishments opened in the year ending March 2020 had closed within five years (BLS Business Employment Dynamics).
2. Put the other way around: 51.4% of US private-sector establishments opened in the year ending March 2020 were still operating five years later, as of March 2025 (BLS Business Employment Dynamics).
The often-repeated claim that nearly all startups fail has no primary dataset behind it; it survives by being quoted from one aggregator to the next. The Bureau of Labor Statistics figures above are what official records actually show. Note that BLS counts establishments across the entire private sector, from restaurants to clinics to software firms. Venture-backed startups play by different rules, and they get their own section below.
Startup Failure Rates by Years in Business
Failure is not a first-year cliff. It is a slow, steady attrition that continues for decades, and the official survival tables show the same curve for every generation of new businesses.
3. 77.9% of US private-sector establishments opened in the year ending March 2024 were still operating one year later, as of March 2025 (BLS Business Employment Dynamics).
4. 22.1% of new US private-sector establishments opened in the year ending March 2024 had closed within their first year (BLS Business Employment Dynamics).
5. 65.9% of US private-sector establishments opened in the year ending March 2023 were still in business two years later, in March 2025 (BLS Business Employment Dynamics).
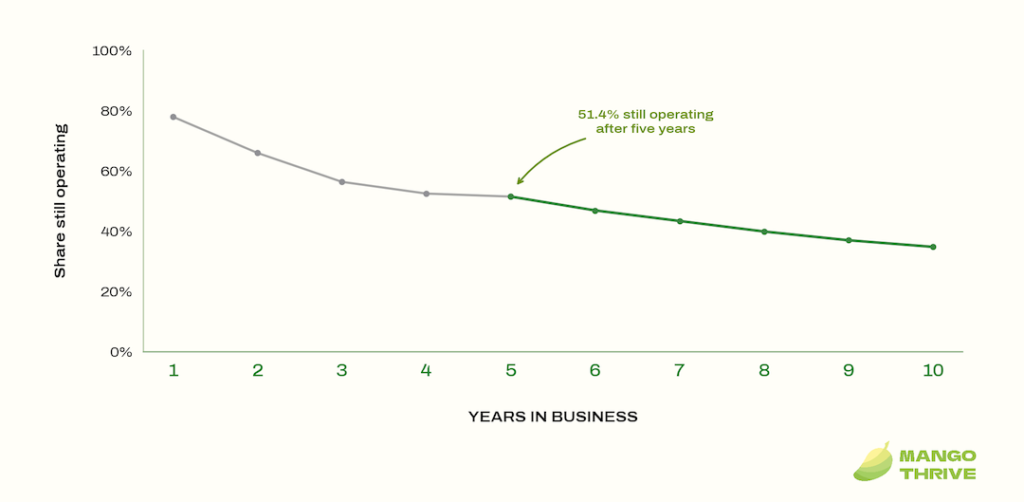
Source: BLS Business Employment Dynamics. Each point shows the share of the cohort opened that many years earlier that was still operating in March 2025.
| Years in business | Share still operating (March 2025) |
|---|---|
| 1 | 77.9% |
| 2 | 65.9% |
| 3 | 56.3% |
| 4 | 52.4% |
| 5 | 51.4% |
| 6 | 46.8% |
| 7 | 43.3% |
| 8 | 39.8% |
| 9 | 36.9% |
| 10 | 34.7% |
Source: BLS Business Employment Dynamics. Each row shows a different opening cohort, all measured in March 2025.
6. 34.7% of US private-sector establishments opened in the year ending March 2015 were still in business ten years later, in March 2025 (BLS Business Employment Dynamics).
7. 25.5% of US private-sector establishments opened in the year ending March 2010 were still operating 15 years later, as of March 2025 (BLS Business Employment Dynamics).
8. 19.5% of US private-sector establishments opened in the year ending March 2005 were still in business 20 years later, in March 2025 (BLS Business Employment Dynamics).
9. Of the US private-sector establishments opened in the year ending March 1994 — the oldest cohort BLS tracks — 12.6% were still operating in March 2025, 31 years later (BLS Business Employment Dynamics).
10. The pipeline keeps refilling: 980,333 new private-sector establishments opened in the US in the year ending March 2025, creating 3,532,614 jobs (BLS Business Employment Dynamics).
According to the US Bureau of Labor Statistics, business survival rates follow a similar path regardless of the year a cohort of establishments was born (BLS, Entrepreneurship and the US Economy). Boom or recession, the curve barely moves.
Why Do Startups Fail?
CB Insights analyzed 431 VC-backed companies that shut down since 2023, drawing on public post-mortems, founder interviews, and shutdown announcements; failure reasons could be identified for 385 of them. Because many startups cited multiple causes, the shares below add up to more than 100%.
11. Running out of capital was cited in 70% of failures among VC-backed startups that shut down since 2023, though CB Insights notes it is almost always the final symptom rather than the root cause (CB Insights).
12. Poor product-market fit was a primary cause in 43% of VC-backed startup failures since 2023 (CB Insights).
13. Bad timing or macro conditions contributed to 29% of VC-backed startup failures since 2023 (CB Insights).
14. Unsustainable unit economics drove 19% of VC-backed startup failures since 2023 (CB Insights).
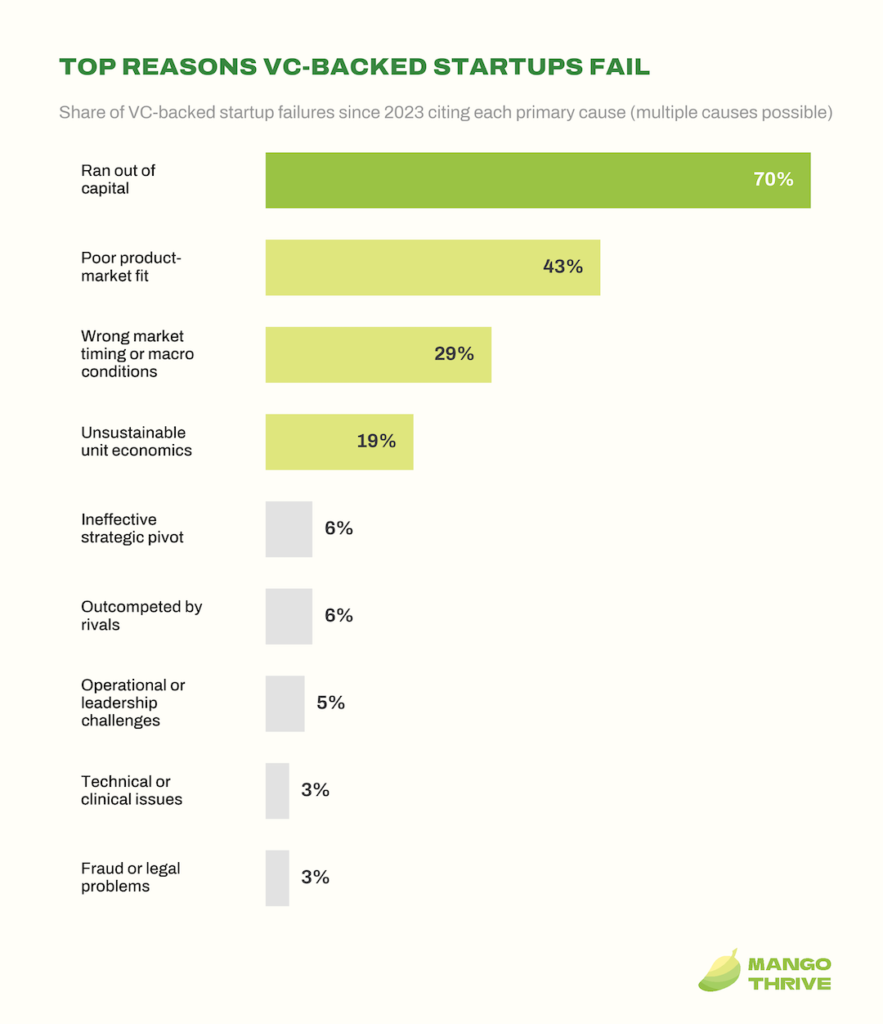
Source: CB Insights. Companies could cite multiple primary causes, so shares exceed 100%.
15. An ineffective strategic pivot was a primary cause in 6% of VC-backed startup failures since 2023 (CB Insights).
16. Being outcompeted by rivals was cited in just 6% of VC-backed startup failures since 2023 (CB Insights).
17. Operational or leadership challenges were a primary cause in 5% of VC-backed startup failures since 2023 (CB Insights).
18. Technical or clinical issues drove 3% of VC-backed startup failures since 2023 (CB Insights).
19. Fraud or legal problems accounted for 3% of VC-backed startup failures since 2023 (CB Insights).
20. Two-thirds of product-market fit failures were early-stage companies, but 20 Series B+ startups also cited poor PMF as a primary cause of their shutdown (CB Insights).
How long do failing startups hold on?
21. The 431 VC-backed startups that shut down since 2023 had raised a combined $17.5 billion in equity funding, with a median of $11 million per company (CB Insights).
22. The median time from a failed startup’s last fundraise to shutdown was 22 months — over half died within two years of their final raise (CB Insights).
23. Nearly a quarter of failed startups had been “walking dead” for over three years since their last raise before officially shutting down (CB Insights).
What are the warning signs before a startup dies?
24. Among failed startups with full 12-month health-score data, 72% saw their CB Insights Mosaic score decline in the year before shutdown, dropping 15% on average (CB Insights).
25. Two-thirds of failed startups with headcount data were already shrinking in the six months before shutdown, and nearly a third died with 10 or fewer employees (CB Insights).
What pressures are small businesses under?
The reasons above come from venture-backed companies. For ordinary small employers, the pressure shows up first in costs and cash flow.
26. Among US small employer firms surveyed in 2025, 77% reported rising costs and/or tariff-related cost increases as a financial challenge in the prior 12 months (Federal Reserve Banks, Small Business Credit Survey).
27. The most common reason US small employer firms sought financing in 2025 was simply to meet operating expenses, cited by 56% of applicants (Federal Reserve Banks, Small Business Credit Survey).
Startup Failure Rates by Industry
The US Bureau of Labor Statistics notes that health care and social assistance consistently ranks among the industries with the highest business survival rates, while construction ranks among the lowest (BLS, Entrepreneurship and the US Economy). The gap between industries is real, but smaller than most listicles suggest.
28. 85.3% of US accommodation and food services establishments opened in the year ending March 2024 survived their first year (BLS BED, Accommodation and Food Services).
The famous claim that most restaurants fail in their first year does not survive contact with this table. Restaurants and hotels actually outperformed the private-sector average in year one.
29. 59.3% of US accommodation and food services establishments opened in the year ending March 2020 were still operating five years later (BLS BED, Accommodation and Food Services).
30. 71.6% of US information-sector establishments (which includes software and media) opened in the year ending March 2024 survived their first year (BLS BED, Information).
31. Only 45.7% of US information-sector establishments opened in the year ending March 2020 were still in business five years later (BLS BED, Information).
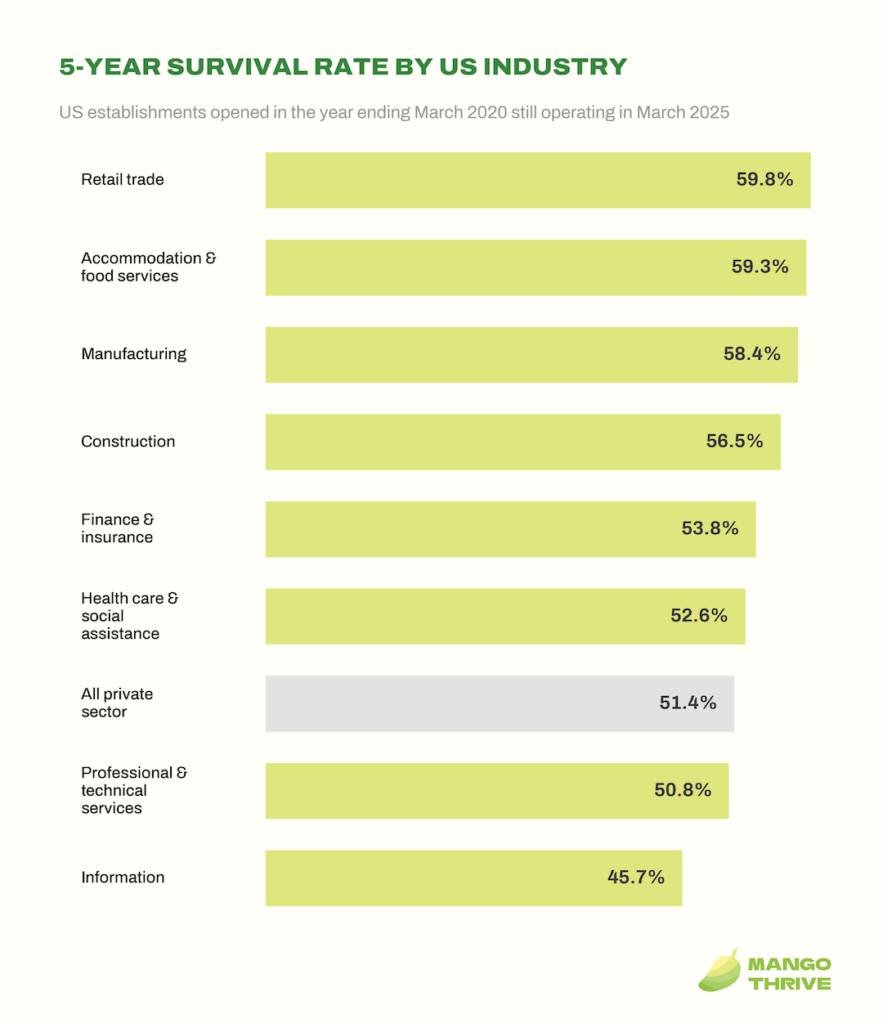
Source: BLS Business Employment Dynamics, Table 7, March 2025 vintage; per-sector files are linked in the stats in this section.
32. 82.1% of US health care and social assistance establishments opened in the year ending March 2024 survived their first year (BLS BED, Health Care and Social Assistance).
33. 52.6% of US health care and social assistance establishments opened in the year ending March 2020 were still operating five years later (BLS BED, Health Care and Social Assistance).
34. 56.5% of US construction establishments opened in the year ending March 2020 were still operating five years later (BLS BED, Construction).
35. 59.8% of US retail trade establishments opened in the year ending March 2020 survived to the five-year mark (BLS BED, Retail Trade).
36. 50.8% of US professional, scientific, and technical services establishments opened in the year ending March 2020 were still in business five years later (BLS BED, Professional Services).
37. 53.8% of US finance and insurance establishments opened in the year ending March 2020 survived five years (BLS BED, Finance and Insurance).
38. 58.4% of US manufacturing establishments opened in the year ending March 2020 were still operating five years later (BLS BED, Manufacturing).
How Many VC-Backed Startups Fail?
Venture-backed startups fail on a different scale than the broader business population. The classic benchmark comes from Harvard, and the recent shutdown wave shows up in equity-platform data.
39. As many as 75% of venture-backed companies never return cash to investors, according to Harvard Business School research on more than 2,000 startups that raised at least $1 million between 2004 and 2010 (Fast Company).
40. Within that group of companies that never returned cash, 30–40% liquidated assets entirely, with investors losing all of their money (Fast Company).
How many startups have shut down recently?
41. 966 US startups on Carta shut down in 2024, up 25.6% from 769 in 2023 (Carta data via TechCrunch).
42. 254 startups on the Carta platform went out of business in Q1 2024, the highest quarterly total of the decade up to that point (Carta, Startup Shutdowns Q1 2024).
43. Startup shutdowns on Carta rose 124% year over year between Q1 2022 and Q1 2023, then grew another 58% between Q1 2023 and Q1 2024 (Carta, Startup Shutdowns Q1 2024).
44. Between Q1 2023 and Q1 2024, company closures on Carta increased 102% at seed, 61% at Series A, and 133% at Series B (Carta, Startup Shutdowns Q1 2024).
45. Of the 254 startups on Carta that shut down in Q1 2024, 136 had raised at least one priced funding round — the first time in five quarters that funded startups shut down more often than unfunded ones (Carta, Startup Shutdowns Q1 2024).
46. AngelList recorded 364 startup winddowns in 2024, a 56.2% jump from 233 in 2023 (AngelList data via TechCrunch).
47. Enterprise SaaS accounted for 32% of startup shutdowns on Carta in 2024, followed by consumer at 11%, healthtech at 9%, fintech at 8%, and biotech at 7% (Carta data via TechCrunch).
48. 74% of startup shutdowns since 2023 were at pre-seed or seed stage, with 41% at seed alone, per SimpleClosure data (SimpleClosure data via TechCrunch).
49. Series A companies jumped from roughly 6% to roughly 14% of all startup shutdowns handled by SimpleClosure between 2024 and 2025 — a 2.5x increase the firm attributes to post-ZIRP companies reaching the end of their runway (SimpleClosure).
50. Startups failing at Series A in 2025 averaged around 7 years old, mostly founded between 2017 and 2019 (SimpleClosure).
51. AI companies made up 15.9% of startup shutdowns handled by SimpleClosure in 2025, down from 17.7% in 2024 (SimpleClosure).
52. The median AI startup that shut down in 2025 had raised around $2.4 million, versus $2.8 million across all SimpleClosure shutdowns (SimpleClosure).
53. B2B SaaS rose from 5.2% to 7.7% of SimpleClosure shutdowns between 2024 and 2025, while developer tools edged up from 6.0% to 6.4% (SimpleClosure).
How hard is it to raise the next round?
54. Only about 17% of startups that raised seed rounds in 2022 reached Series A within two years on Carta, down from the 25–30% graduation rate of the 2018 cohort (Carta, Seed to Series A Graduation Rate).
55. Startups on Carta closed just 4,859 new funding rounds in 2025 — the lowest annual total in at least six years and down 41% from the 2021 peak (Carta, State of Private Markets 2025).
56. The share of down rounds on Carta fell to 11.4% in Q1 2026, back in line with 2019–2020 levels (Carta, State of Private Markets Q1 2026).
Startup Survival Rates Around the World
Business failure is not an American phenomenon, and statistical agencies in other countries run their own survival tables. Definitions differ from country to country, so treat each block below on its own terms.
United Kingdom
57. The UK recorded 317,000 business births in 2024, a birth rate of 11.1% of all active businesses (ONS, Business Demography UK 2024).
58. UK business deaths fell to 280,000 in 2024, pushing the death rate down to 9.8% — the lowest since 2016 (ONS, Business Demography UK 2024).
59. 93.4% of UK businesses born in 2023 survived their first year of trading (ONS, Business Demography UK 2024).
60. Only 38.4% of UK businesses born in 2019 were still trading five years later, in 2024 (ONS, Business Demography UK 2024).
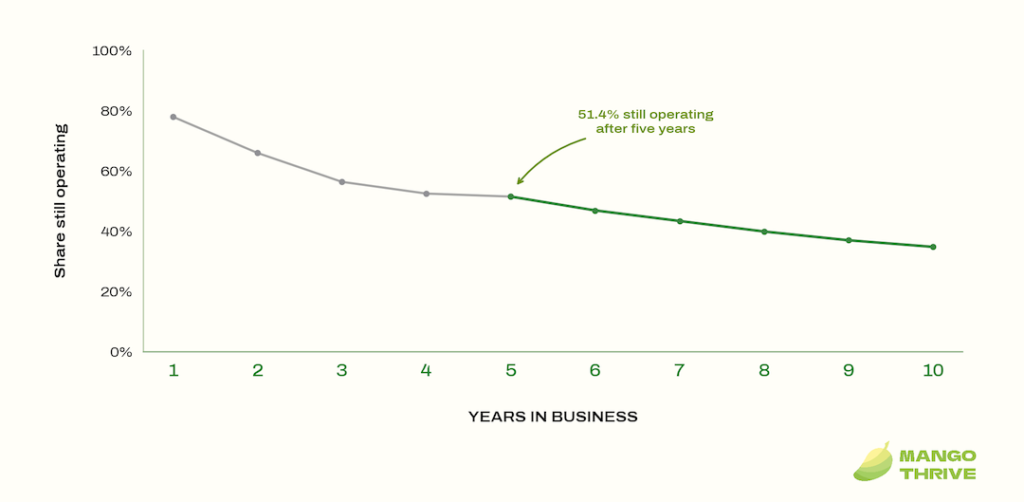
Source: ONS, Business Demography UK 2024, five-year survival of the 2019 cohort.
| Years since birth (2019 cohort) | Share still trading |
|---|---|
| 1 | 94.6% |
| 2 | 74.7% |
| 3 | 55.9% |
| 4 | 45.0% |
| 5 | 38.4% |
Source: ONS, Business Demography UK 2024.
European Union
61. Across the EU’s more than 33 million enterprises, 3.5 million new businesses were born in 2023, a birth rate of 10.5% (Eurostat).
62. An estimated 2.8 million EU enterprises closed in 2023, a preliminary death rate of 8.5% (Eurostat).
63. Lithuania had the EU’s highest enterprise birth rate in 2023 at 19.6%, followed by Malta (17.1%) and Portugal (16.8%), while Austria had the lowest at 6.2% (Eurostat).
64. Estonia registered the EU’s highest enterprise death rate in 2023, with 27.5% of its businesses closing in a single year (Eurostat).
Canada
65. 68.0% of Canadian businesses with 1–99 employees were still operating five years after launch, based on cohorts tracked from 2001 to 2022 (ISED, Key Small Business Statistics 2025).
66. 48.2% of Canadian businesses with 1–99 employees survived at least 10 years, per cohorts tracked from 2001 to 2022 (ISED, Key Small Business Statistics 2025).
67. Canada saw an average of 105,001 new employer businesses created each year from 2018 to 2022, and 91.2% of them started with just 1–4 employees (ISED, Key Small Business Statistics 2025).
Australia
68. Australia had 2,729,648 actively trading businesses as of 30 June 2025 (ABS, Counts of Australian Businesses).
69. Australians started 437,150 new businesses in 2024–25 (a 16.4% entry rate) while 370,500 businesses exited (a 13.9% exit rate) (ABS, Counts of Australian Businesses).
United States: the pipeline keeps growing
70. Americans filed 578,926 new business applications in July 2026 alone, up 8.1% from June (US Census Bureau, Business Formation Statistics).
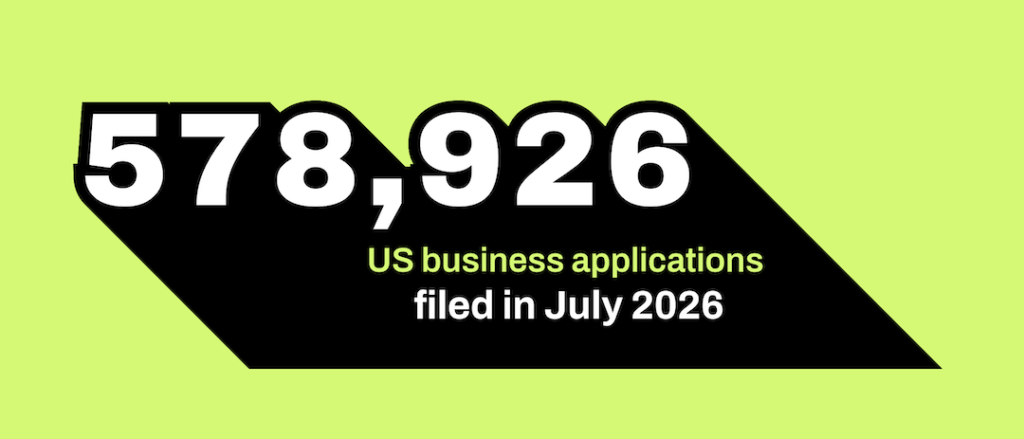
Source: US Census Bureau, Business Formation Statistics, seasonally adjusted.
Conclusion
The data tells a more patient story than the folklore. Failure is a multi-year process rather than a first-year cliff, the causes show up in product-market fit and unit economics long before the money runs out, and US survival curves have repeated the same path for decades. For founders, the lesson is less about beating impossible odds and more about watching the signals that official data says actually precede a shutdown.