
84 Women in Tech Statistics for 2026
Women hold far fewer tech jobs than men. The gap shows up in computer science classes. It also appears in hiring, pay, leadership and startup funding. Data on who uses AI tools now shows a gender gap too. Here are the latest statistics on where women stand in tech.
Top Women in Tech Statistics
- 23% of tech team members were women in 2025, according to digital leaders surveyed worldwide (Nash Squared).
- 19.5% of ICT specialists in the EU were women in 2025 (Eurostat, ICT specialists in employment).
- Women held 27.5% of US computer and mathematical jobs in 2025 (BLS).
- Women earned 25.1% of computer science bachelor’s degrees at responding US and Canadian computing units in 2024–25 (CRA Taulbee Survey, bachelor’s degrees).
- $1,828 was the median weekly pay of US women working full time in computer and mathematical occupations in 2025, vs. $2,138 for men (U.S. Bureau of Labor Statistics).
- 27.7% of US venture capital deal value went to female-founded companies in 2025 (PitchBook, 2025 US All In). The share was 10.0% in 2010. The share excludes OpenAI and companies whose founders’ gender is not disclosed.
- An estimated 39.3% of women and 47.8% of men used generative AI, according to a 2026 review of studies worldwide (Harvard Business School).
- 13% of the digital leaders surveyed worldwide were women in 2025 (Nash Squared).
What Share of Tech Workers Are Women?
These figures come from a global survey of technology leaders about the teams they run.
1. 23% of tech team members were women in 2025, according to digital leaders surveyed worldwide (Nash Squared).
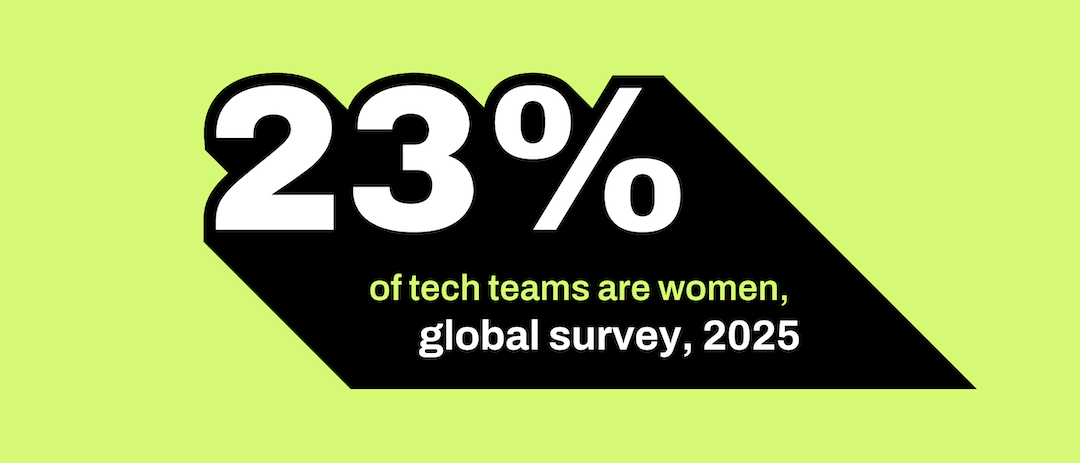
Share of tech team members who are women, global survey of tech leaders, 2025
Source: Nash Squared, Digital Leadership Report 2025. Survey of technology leaders in 62 countries.
2. 31% of tech team members in Asia were women in 2025, versus 23% in Europe, according to digital leaders surveyed (Nash Squared). North America and Australasia were both at 27%.
3. 25% of new hires into tech teams were women in 2025, down from 27% in 2023 (Nash Squared).
How Does Women’s Share of Tech Jobs Vary by Country?
These figures show women’s share of tech jobs from national statistics offices and industry groups.
Europe
In Eurostat’s data, “ICT specialists” means people who can develop, operate and maintain ICT systems, and for whom ICT is the main part of their job.
4. 19.5% of ICT specialists in the EU were women in 2025 (Eurostat, ICT specialists in employment).
| Country | Women’s share of ICT specialists, 2025 |
|---|---|
| EU total | 19.5% |
| North Macedonia | 31.7% |
| Romania | 27.8% |
| Bosnia and Herzegovina | 26.5% |
| Latvia | 25.9% |
| Bulgaria | 25.0% |
| Sweden | 24.6% |
| Finland | 24.3% |
| Norway | 22.9% |
| Estonia | 22.5% |
| Lithuania | 22.5% |
| Portugal | 22.3% |
| Ireland | 22.0% |
| Denmark | 21.1% |
| Serbia | 20.8% |
| Cyprus | 20.1% |
| Germany | 20.0% |
| Luxembourg | 20.0% (low reliability) |
| Austria | 19.7% |
| France | 19.6% (definition differs) |
| Netherlands | 19.6% |
| Spain | 19.5% (definition differs) |
| Türkiye | 19.2% |
| Slovenia | 19.0% |
| Croatia | 18.4% |
| Belgium | 17.6% |
| Switzerland | 17.4% |
| Malta | 17.1% |
| Greece | 17.0% |
| Italy | 16.6% |
| Poland | 16.6% |
| Slovakia | 15.5% |
| Hungary | 15.0% |
| Czechia | 12.9% |
Source: Eurostat, dataset isoc_sks_itsps. Includes EU members and other European countries. Most values are Eurostat estimates.
5. Women’s share of EU ICT specialists rose from 16.5% in 2015 to 19.5% in 2025 (Eurostat, dataset isoc_sks_itsps).
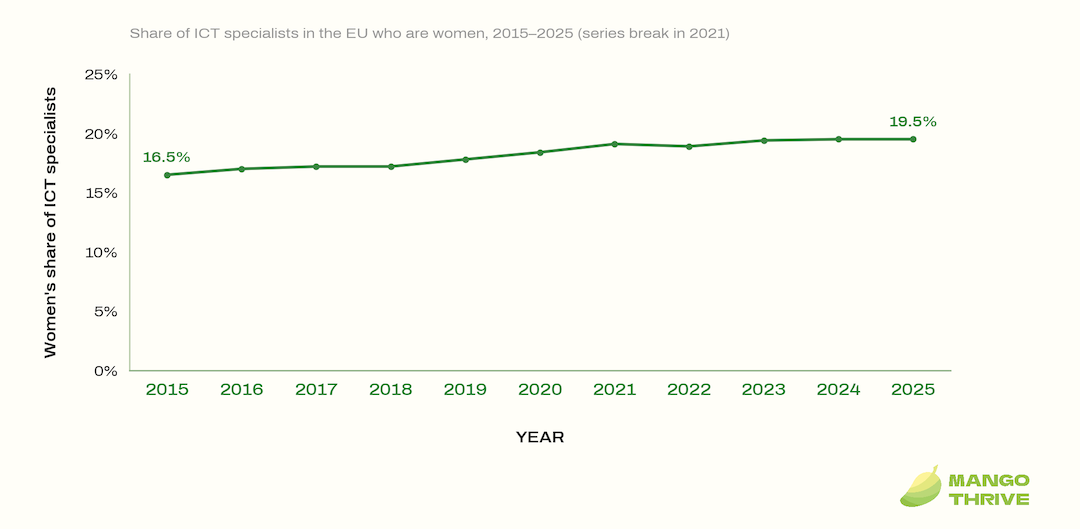
Women’s share of ICT specialists in the EU, 2015 to 2025
Source: Eurostat, dataset isoc_sks_itsps. Series break in 2021.
6. The number of women ICT specialists in the EU grew 89.1% between 2015 and 2025 (Eurostat, ICT specialists in employment). The number of men grew 53.5% over the same period.
7. About 2.04 million women worked as ICT specialists in the EU in 2025 (Eurostat, dataset isoc_sks_itsps).
United States
In the BLS’s data, “computer and mathematical occupations” means computer jobs such as software developers, analysts and IT support, plus math jobs such as statisticians, actuaries and data scientists.
8. Women held 27.5% of US computer and mathematical jobs in 2025 (BLS). Women made up 47.1% of all employed people.
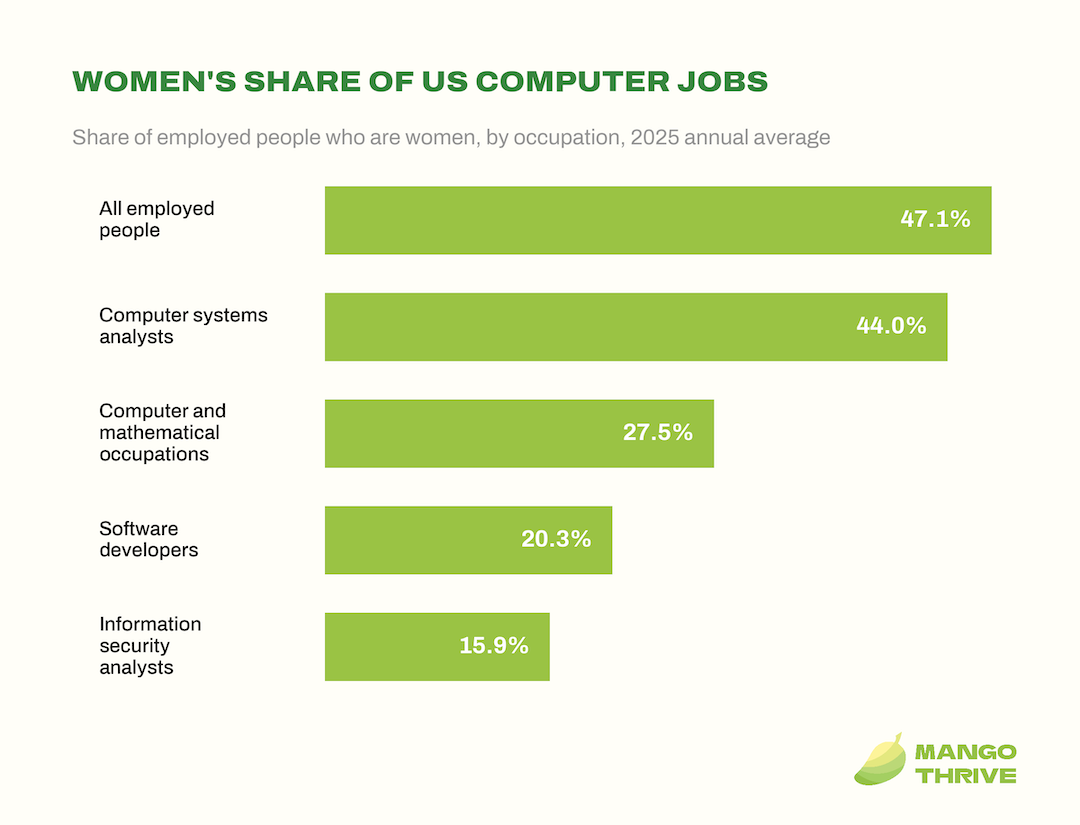
Women’s share of US computer jobs by occupation, 2025
Source: U.S. Bureau of Labor Statistics, Current Population Survey Table 11. 2025 annual averages, based on 11 months because October 2025 data was not collected.
9. Women were 20.3% of US software developers in 2025 (BLS).
10. Women were 15.9% of US information security analysts in 2025 (BLS).
11. Women were 44.0% of US computer systems analysts in 2025 (BLS).
United Kingdom
In BCS’s data, “IT specialists” means people in IT job codes of the UK occupational classification: IT and telecoms directors, IT professionals, IT technicians, and IT and telecoms engineers.
12. Women made up 22% of UK IT specialists in 2024 (BCS, Gender Diversity in the Tech Sector 2025). That was 441,000 women.
13. Women were 6% of UK IT engineers, on average over 2020–2024 (BCS, Gender and IT Employment).
14. 13% of women IT specialists in the UK worked part-time in 2024, versus 3% of men (BCS, Gender Diversity in the Tech Sector 2025).
Canada
15. 31.5% of women in Canada with a computer and information science credential worked in math or computer jobs in 2020 or 2021 (Statistics Canada, 2021 Census). Among men with the same credential, the share was 50.1%, based on the 2021 Census.
Australia
In the Tech Council of Australia’s data, “highly technical workforce” means jobs that need specialised technological knowledge and skills, such as software engineers, AI researchers, physicists and mathematicians.
16. Women made up 20% of Australia’s highly technical workforce, according to a 2025 report (Tech Council of Australia). The figure is based on 2021 Census data for workers aged 25 to 44.
17. Women were 21% of software developers aged 25 to 44 in Australia, based on 2021 Census data (Tech Council of Australia).
Worldwide
STEM covers science, technology, engineering and math jobs.
18. Women made up 28.2% of the STEM workforce in 2024, based on LinkedIn data (World Economic Forum). The share was 26.1% in 2016.
How Many Tech Leaders Are Women?
These figures cover women in senior technology roles and at several large tech employers.
In Nash Squared’s data, “digital leaders” means the senior technology decision-makers it surveys, such as CIOs and IT directors.
19. 13% of the digital leaders surveyed worldwide were women in 2025 (Nash Squared). The survey covered 2,015 technology leaders in 62 countries.
Women at Large Tech Companies
A percentage point is the simple difference between two percentages.
20. 31.6% of Microsoft’s core global workforce were women in 2024 (Microsoft). That was up 0.4 percentage points from the year before.
21. 27.2% of technical roles in Microsoft’s core workforce were held by women in 2024 (Microsoft). That was up 0.5 percentage points from the year before.
22. 39.5% of Infosys’s workforce were women in fiscal 2026, or 129,625 people (Infosys).
23. 21.2% of senior-level employees at Infosys were women in fiscal 2026 (Infosys).
24. 35.3% of TCS employees were women in fiscal 2026, or 217,878 of 617,437 (TCS BRSR).
25. 39,891 of SAP’s 111,397 employees were women at the end of 2025 (SAP, Integrated Report 2025).
26. 30.9% of SAP’s senior executive roles were held by women in 2025, up from 29.9% in 2024 (SAP, equality metrics 2025).
27. 26% of Fujitsu employees were women in fiscal 2024 (Fujitsu).
28. 17% of Fujitsu managers were women in fiscal 2024 (Fujitsu).
How Many Women Study Computer Science?
These figures follow women through computer science, IT and STEM courses and degrees, from high school to PhD.
United States and Canada
29. Women earned 25.1% of computer science bachelor’s degrees at responding US and Canadian computing units in 2024–25 (CRA Taulbee Survey, bachelor’s degrees). The share counts only graduates whose gender was known.
30. Women earned 28.1% of computer science master’s degrees at responding US and Canadian computing units in 2024–25 (CRA Taulbee Survey, master’s degrees).
31. Women earned about 23.6% of computer science PhDs at responding US and Canadian computing units in 2024–25 (CRA Taulbee Survey, doctoral degrees). That was 414 of 1,757 doctorates where gender was known.
In the CRA Taulbee Survey’s data, “information (IN)” is one of three computing fields it tracks, alongside computer science (CS) and computer engineering (CE).
32. Women earned 39.8% of information bachelor’s degrees at responding US and Canadian computing units in 2024–25 (CRA Taulbee Survey, bachelor’s degrees).
AP Computer Science Principles and AP Computer Science A are US high school courses, each with a national exam.
33. Female students made up 34% of AP Computer Science Principles participants in 2024 (College Board). For AP Computer Science A, the share was 26%.
34. 60,259 women took the AP Computer Science Principles exam in 2024 (College Board). That was more than four times the number who tested in 2017.
Europe and the UK
In Eurostat’s data, “ICT” (information and communication technologies) education means study in computer use, database and network design and administration, software and applications development and analysis, and inter-disciplinary programmes.
35. The EU had 3.7 times as many male as female ICT graduates in 2024 (Eurostat, gender gap between graduates).
36. Men made up 79.1% of college and university students in ICT fields across the EU in 2024 (Eurostat, tertiary education statistics).
37. UK 18-year-olds placed on computing degrees in 2025 were men and women in a 4:1 ratio (BCS, Demand for UK Computing Degrees). The ratio was 5.5:1 in 2019/20.
Australia
38. Women made up 23% of university information technology enrolments and completions in Australia in 2024 (Australian Government STEM Equity Monitor).
India
39. Women made up 30.1% of undergraduate engineering and technology students in India in 2022–23 (AISHE 2022–23). India had 4.06 million undergraduate students in these programs.
In AISHE’s data, “STEM” means the science stream (including mathematics) plus the engineering and technology stream.
40. Women were 44% of students in STEM higher education in India in 2023–24 (India Ministry of Education). The share was 38.4% in 2014–15.
Worldwide
41. Women were only 35% of STEM graduates worldwide in 2018–23 (UNESCO GEM Report). The share showed no progress over the past ten years.
How Much Do Women in Tech Earn Compared With Men?
These figures compare pay for women and men in tech, using government data and company pay reports.
United States
In the BLS’s data, “median weekly pay” means usual weekly earnings before taxes, including overtime, commissions and tips, for people who usually work 35 or more hours a week.
42. $1,828 was the median weekly pay of US women working full time in computer and mathematical occupations in 2025, vs. $2,138 for men (U.S. Bureau of Labor Statistics). The figures cover full-time wage and salary workers.
| Occupation (US, full-time wage and salary workers) | Women, median weekly pay, 2025 | Men, median weekly pay, 2025 |
|---|---|---|
| Computer and mathematical occupations | $1,828 | $2,138 |
| Computer and information systems managers | $2,305 | $2,691 |
| Software developers | $2,383 | $2,523 |
| Computer systems analysts | $1,658 | $1,947 |
| Computer support specialists | $1,348 | $1,452 |
| Computer programmers | $1,406 | $2,131 |
| All full-time wage and salary workers | $1,089 | $1,326 |
Source: U.S. Bureau of Labor Statistics, Current Population Survey Table 39. 2025 annual averages, based on 11 months because October 2025 data was not collected.
United Kingdom
43. Women at Google UK had 11.0% lower median hourly pay than men in April 2025 (UK Gender Pay Gap Service, Google UK). Google UK Limited has 5,000 to 19,999 employees.
44. Women at Google UK had 32% lower median bonus pay than men in the 2025 report (UK Gender Pay Gap Service, Google UK).
45. Women at Microsoft UK had 5.6% lower median hourly pay than men in April 2025 (UK Gender Pay Gap Service, Microsoft UK).
Europe
In Eurostat’s data, “unadjusted gender pay gap” means the difference between men’s and women’s average gross hourly earnings, as a share of men’s average gross hourly earnings.
46. 19.3% was Germany’s unadjusted gender pay gap in the information and communication sector in 2024 (Eurostat, gender pay gap by sector). The figure is provisional.
47. 11.3% was France’s unadjusted gender pay gap in the information and communication sector in 2024 (Eurostat, gender pay gap by sector). The figure is provisional.
48. 9.5% was Spain’s unadjusted gender pay gap in the information and communication sector in 2024 (Eurostat, gender pay gap by sector). The figure is provisional.
Australia
In WGEA’s data, the “mid-point employer gender pay gap” is the gap that splits employers in half: half have a larger gap and half a smaller one. “Total pay” is base salary plus additional payments such as superannuation, bonuses and overtime.
49. A$133,184 was the average total pay of women in Australia’s information media and telecommunications industry in 2024–25, vs. A$166,359 for men (WGEA). The data covers employers that report to WGEA, which applies once they have 100 or more employees.
50. 12.3% was the mid-point employer gender pay gap in Australia’s information media and telecommunications industry in 2024–25 (WGEA). It is based on average total pay.
Japan
51. ¥350,300 was the average monthly scheduled pay of women in Japan’s information and communications industry in June 2025, vs. ¥428,100 for men (MHLW). It covers regular workers other than short-time workers, at private establishments with 10 or more regular employees.
How Much Venture Capital Goes to Women Founders?
These figures cover venture capital for companies with women founders, and women among investors.
United States
In PitchBook’s data, “female-founded” means a venture-backed company with at least one female founder.
Venture capital (VC) is money invested in young, fast-growing companies. Deal value is the total amount invested in VC deals.
52. $73.6 billion went to US venture-backed female-founded companies in 2025, a record (PitchBook, 2025 US All In). The number of deals for these companies fell to 3,219 from 3,568 in 2024.
53. 27.7% of US venture capital deal value went to female-founded companies in 2025 (PitchBook, 2025 US All In). The share was 10.0% in 2010. The share excludes OpenAI and companies whose founders’ gender is not disclosed.
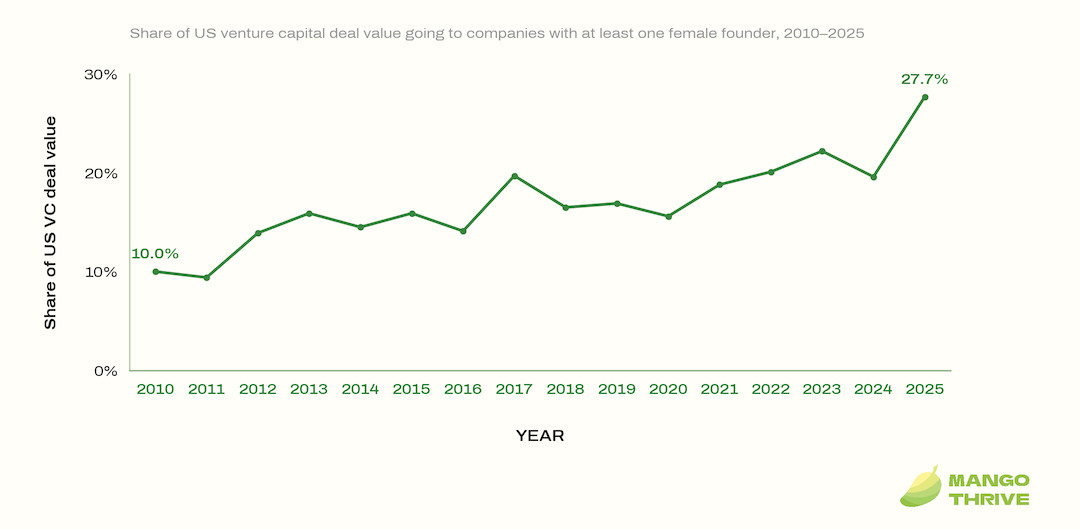
Share of US venture capital deal value going to female-founded companies, 2010 to 2025
Source: PitchBook, 2025 US All In: Female Founders in the VC Ecosystem. Excludes OpenAI and companies whose founders’ gender is not disclosed.
54. $3.2 billion went to US companies founded only by women in 2025, across 797 deals (PitchBook, 2025 US All In).
In PitchBook’s data, “decision-makers” means partners, principals and managing directors at venture capital firms.
55. 18.0% of decision-makers at US venture capital firms managing $50 million or more were women at the end of 2025 (PitchBook, 2025 US All In). At firms managing less, the share was 20.2%.
Europe
56. €9.5 billion went to European female-founded companies across more than 1,800 VC deals in 2025 (PitchBook, 2025 European All In).
57. 1.3% of European VC deal value went to all-female founding teams in 2025 (PitchBook, new VC funds for female founders). Mixed-gender teams took 15%.
58. 13% of decision-makers at smaller European VC firms were women in 2025 (PitchBook, Europe’s VC gender gap). This covers firms managing under €50 million, up from 8.3% in 2024.
United Kingdom
59. 2% of UK small-business equity investment went to all-female founder teams in 2025 (British Business Bank). These teams raised 7% of equity deals, unchanged from 2024.
60. 25% of UK equity deals went to teams with at least one female founder in 2025 (British Business Bank). Their share of investment value fell from 18% to 15%.
61. One of 321 UK AI deals above £10 million since 2021 went to an all-female founding team (British Business Bank).
Australia
62. 24% of Australian startup capital went to startups with at least one female founder in 2025 (Cut Through Venture). They also took 24% of deals, down from 28% in 2024.
How Many Women Work in AI?
These figures cover women’s share of people working in AI roles or listing AI skills.
In interface’s data, “AI talent” means people whose past job titles include terms such as “Machine Learning” or “AI”, or whose profile skills include one of 11 AI skills, such as machine learning or deep learning.
63. Women make up 22% of AI talent worldwide, according to a 2024 analysis (interface). They hold less than 14% of senior executive roles in AI.
64. Women were 29.4% of LinkedIn members listing AI engineering skills in 2025, up from 23.5% in 2018 (World Economic Forum).
How Many Women Use Generative AI?
Generative AI tools create text, images or other content in response to a user’s prompt. These figures compare how many women and men use them.
Worldwide
65. An estimated 39.3% of women and 47.8% of men used generative AI, according to a 2026 review of studies worldwide (Harvard Business School). The figures combine 318,924 people surveyed or tracked across 54 sources.
66. About 40% of visitors to the 10 most popular AI websites were women in January 2026, on average (Harvard Business School). The figure averages each site’s share of worldwide traffic from women.
67. Around 80% of ChatGPT’s weekly users had typically masculine names in its first months, a 2025 OpenAI study found (OpenAI / NBER). The estimate excludes users whose name gender was unknown.
68. More than half of ChatGPT’s weekly users had typically female names by July 2025 (OpenAI / NBER). Gender was inferred from users’ first names.
United States
69. Women made up 44.1% of US visitors to chatgpt.com and 26.7% to grok.com (Harvard Business School). All ten AI tools studied had more male than female visitors, per SimilarWeb data from August 2025 to January 2026.
70. 50% of US men and 47% of women say they use AI chatbots, in 2026 (Pew Research Center). Pew describes men and women as now equally likely to say they use them.
71. 44% of both US men and women say they use ChatGPT, in 2026 (Pew Research Center). The survey of 5,119 US adults ran February 17–23, 2026.
72. 35% of US men vs 25% of women say AI chatbots help their productivity, in 2026 (Pew Research Center). Base is all US adults; “helps a lot” and “helps a little” are combined.
Europe
In Eurostat’s data, “generative AI tools” means tools that can create text, images or other content in response to user prompts. The survey counts people who used them in the three months before they were asked.
73. 34.9% of men and 30.5% of women in the EU used generative AI tools in 2025 (Eurostat, use of AI by individuals). The figures cover people aged 16–74 who used the tools in the three months before the survey.
| Country | Women aged 16–74 who used generative AI tools, 2025 | Men aged 16–74 who used generative AI tools, 2025 |
|---|---|---|
| EU total | 30.5% | 34.9% |
| Norway | 52.7% | 59.9% |
| Estonia | 47.4% | 45.8% |
| Malta | 47.4% | 45.7% |
| Finland | 45.0% | 47.5% |
| Denmark | 44.5% | 52.4% |
| Switzerland | 43.5% | 50.6% |
| Greece | 42.6% | 45.6% |
| Cyprus | 42.5% | 46.0% |
| Netherlands | 41.9% | 47.5% |
| Belgium | 41.4% | 42.6% |
| Ireland | 40.3% | 49.6% |
| Luxembourg | 39.4% | 45.5% |
| Sweden | 38.5% | 45.4% |
| Slovenia | 38.3% | 36.8% |
| Portugal | 37.7% | 39.8% |
| Lithuania | 37.6% | 36.2% |
| Austria | 37.3% | 41.6% |
| Spain | 35.9% | 39.9% |
| France | 35.2% | 39.8% |
| Czechia | 33.3% | 37.6% |
| Latvia | 32.3% | 34.7% |
| Germany | 29.6% | 34.9% |
| Croatia | 28.2% | 26.9% |
| Slovakia | 27.3% | 34.3% |
| Hungary | 26.5% | 32.7% |
| Albania | 25.5% | 29.1% |
| North Macedonia | 24.2% | 20.4% |
| Bulgaria | 21.7% | 23.3% |
| Poland | 19.1% | 26.4% |
| Italy | 18.3% | 21.4% |
| Bosnia and Herzegovina | 18.0% | 22.1% |
| Türkiye | 16.4% | 18.0% |
| Romania | 16.0% | 19.6% |
| Serbia | 14.9% | 22.5% |
Source: Eurostat, dataset isoc_ai_iaiu. Includes EU members and other European countries. Use in the three months before the survey; figures rounded to one decimal.
74. 16.9% of men and 13.9% of women in the EU used generative AI for work in 2025 (Eurostat, use of AI by individuals). The base is all people aged 16–74, not only workers.
Canada
75. 22% of both employed women and men aged 15 to 69 in Canada used generative AI at work, September 2024–July 2025 (Statistics Canada, workplace AI use). The figure covers use in the past 12 months, from the Canadian Survey on Working Conditions.
76. 55% of men vs 47% of women in Canada’s professional, scientific and technical services used generative AI at work (Statistics Canada, workplace AI use). Data covers September 2024 to July 2025.
Software Engineers
77. 43% of male and 31% of female software engineers at one global tech company used a new AI coding tool within a year (Gai, Hou & Tu). The study tracked 28,698 full-time engineers in 2024.
What Do Women in Tech Say About Their Jobs?
These figures come from a survey of women working in tech.
78. 31% of women in tech were considering leaving their organization within 12 months (Skillsoft). Skillsoft surveyed more than 500 women in tech between September 2023 and January 2024.
79. 85% of women in tech surveyed by Skillsoft say there’s a gender disparity within their team, in a 2024 survey (Skillsoft).
How Many Cybersecurity Teams Include Women?
These figures come from a global study of cybersecurity professionals, based on what they report about their teams and the barriers women face.
80. 14% of cybersecurity professionals surveyed by ISC2 said their team has no women, in a March 2026 report (ISC2).
81. 23% is the average share of women on security teams reported by ISC2 participants in India, the highest of eight countries reported, per a March 2026 report (ISC2). Participants in Germany and the Netherlands reported the smallest perceived share.
82. 34% of women in cybersecurity say pay or promotion inequity has prevented women from moving forward, vs. 19% of men, per a 2026 ISC2 report (ISC2).
83. 45% of women in cybersecurity name work-life balance and caregiving demands as women’s top challenge, vs. 29% of men, per a 2026 ISC2 report (ISC2).
84. 42% of men in cybersecurity say they are unaware of any significant barriers for women, vs. 17% of women, per a 2026 ISC2 report (ISC2).
Conclusion
Women’s share of tech work is rising in some places, but slowly. The gap is wide in software, engineering and security roles and among tech leaders. Venture funding for US companies with at least one woman founder hit a record, while teams made up only of women raised much less. Studies of generative AI use show a gap too, though some recent surveys find men and women use it about equally. We’ll update this page as new data comes out.