Wondering if SEO is worth the cost? Just enter your numbers to get instant projections for traffic growth and revenue, and see exactly when you’ll break even.
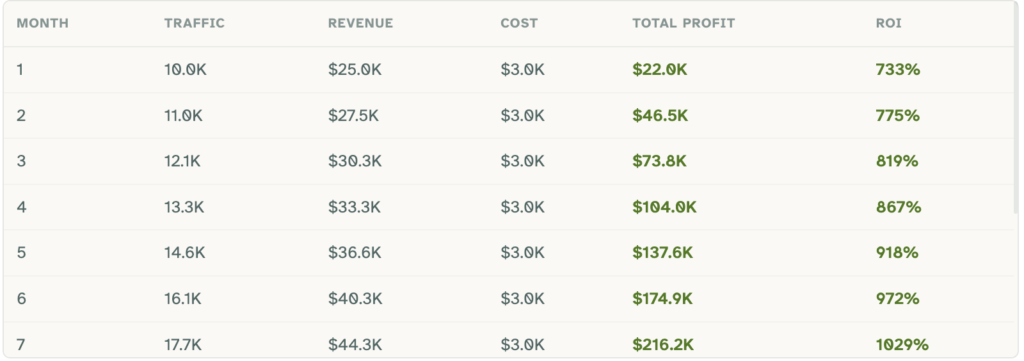
| Month | Traffic | Revenue | Cost | Total Profit | ROI |
|---|
How to use this calculator?
This free tool helps you estimate your SEO ROI in seconds.
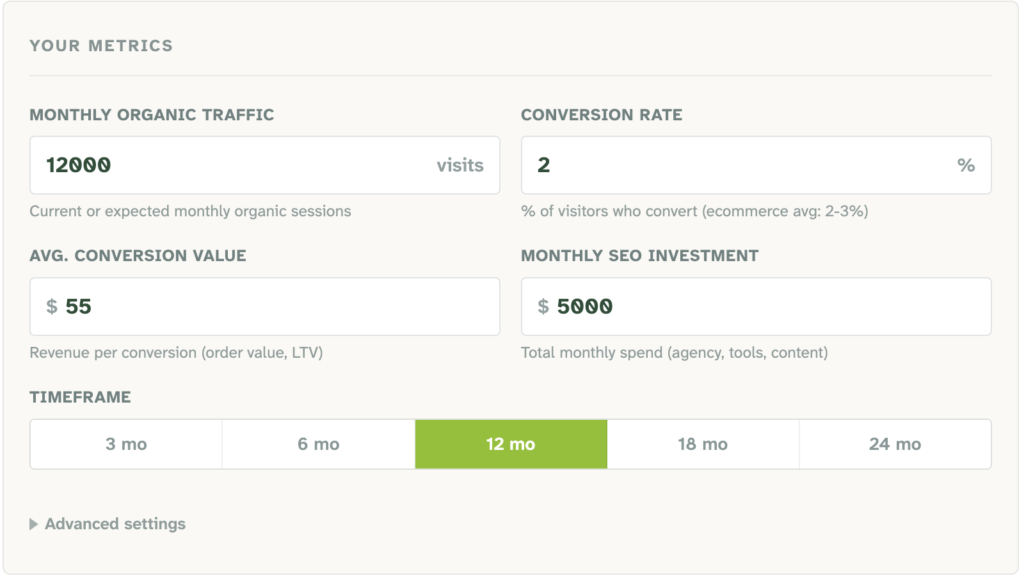
Pop your current SEO metrics into the four fields, and the calculator will update your results in real time, no need to click anything.
It’s that simple.
Monthly organic traffic is the number of visitors (or traffic) coming from search engines like Google to your website each month.
Tip: You can easily find this data in Google Analytics under Acquisition > Organic Search.
In case you haven’t launched your SEO campaign yet, just use your target traffic as a starting point.
Conversion rate is the percentage of those visitors who take action, such as making a purchase, filling out a form, or signing up for a trial.
Average conversion value is how much each conversion is worth. Say you run an e-commerce site, this is your average order value. Or, for lead generation, you enter your estimate of each lead’s value in the field. For example, if 10% of your leads close at $5000, then each lead is worth $500. For SaaS, you can use your average customer lifetime value (LTV).
Monthly SEO investment is your total investment in SEO each month. Just take all the costs that come to your mind: the agency fees, tools like Ahrefs or Semrush, your content production, or any in-house team costs.
Timeframe lets you choose how far ahead you want to forecast. We recommend at least 12 months, as SEO takes time to see real results. Short timeframes often show you negative ROI, simply because SEO hasn’t had enough time to build momentum.
Advanced settings opens the traffic growth rate. We set this field’s default to 10% months-over-month. This number simulates your SEO compound effect, like a snowball rolling out, where next month’s traffic is better than the last.
Understanding your results
The calculator gives you your projected ROI percentage, total revenue vs. cost, net profit, and the payback period. Here’s the breakdown:
Projected ROI is the biggest one; it shows the percentage return on your total SEO spend.
Net Profit is the difference between total revenue and total cost.
Payback Period tells you the exact month when your total revenue is more than your total spending. This is when SEO starts to pay for itself. Sound good, right?
The monthly breakdown table shows how your traffic, revenue, and profit grow over time. This lets you see the compounding effect of SEO month by month in detail.
One more thing:
You can click the Export PNG button to download your results as an image; it’s useful for sharing with clients, including in proposals, or for presenting to stakeholders.