
Retail is where people meet the economy every day. The industry sells cars, groceries, clothes and nearly everything else, in stores and online. This page covers how much retailers sell, where those sales happen, who works in retail and how retailers use AI. Here are the latest retail industry statistics.
Top Retail Industry Statistics
- U.S. retail sales reached $7.32 trillion in 2025, excluding food services (U.S. Census Bureau, Monthly Retail Trade).
- 17.1% of U.S. retail sales were made online in Q2 2026, seasonally adjusted (U.S. Census Bureau, Quarterly Retail E-Commerce Sales).
- 15.48 million people worked in US retail trade in September 2026, seasonally adjusted (BLS, Current Employment Statistics).
- The U.S. had 1,043,373 retail establishments with paid employees in 2023 (U.S. Census Bureau, County Business Patterns).
- $6.03 trillion was the combined retail revenue of the world’s 250 largest retailers in fiscal 2023 (Deloitte, Global Powers of Retailing 2025).
- Retailers estimated that $849.9 billion in merchandise, or 15.8% of annual sales, would be returned in 2025 (NRF and Happy Returns, 2025 Retail Returns Landscape).
- 16.5% of U.S. retail businesses used AI in a business function in the survey collected Sept. 7–20, 2026 (U.S. Census Bureau, Business Trends and Outlook Survey).
- 50,120.2 billion yuan of consumer goods were sold at retail in China in 2025, up 3.7% from 2024 (National Bureau of Statistics of China, 2025 Statistical Communiqué).
How Big Is the Retail Industry?
These Census Bureau and BEA figures measure the US retail industry by sales and by its share of the economy.
1. U.S. retail sales reached $7.32 trillion in 2025, excluding food services (U.S. Census Bureau, Monthly Retail Trade).
2. U.S. retail and food services sales totaled $8.35 trillion in 2025 (U.S. Census Bureau, Monthly Retail Trade). The estimate covers only businesses with paid employees.
3. Retail trade accounted for 5.9% of U.S. GDP in 2025, compared with 6.8% in 1997 (U.S. Bureau of Economic Analysis, GDP by Industry).
Is the Retail Industry Growing?
These figures track US retail sales over time. Seasonally adjusted figures remove the normal ups and downs of the calendar.
4. U.S. retail and food services sales reached $4.97 trillion from January to July 2026, versus $4.76 trillion in the same months of 2025, not seasonally adjusted (U.S. Census Bureau, Monthly Retail Trade). July is a preliminary estimate.
5. Seasonally adjusted U.S. retail and food services sales were $729.5 billion in July 2026 (U.S. Census Bureau, Monthly Retail Trade). The July figure is preliminary.
6. The National Retail Federation forecasts U.S. retail sales will grow 4.4% in 2026 to $5.6 trillion (National Retail Federation). NRF made the forecast in March 2026 with Oxford Economics.
7. U.S. retail sales were $4.64 trillion in 2015, excluding food services (U.S. Census Bureau, Monthly Retail Trade).
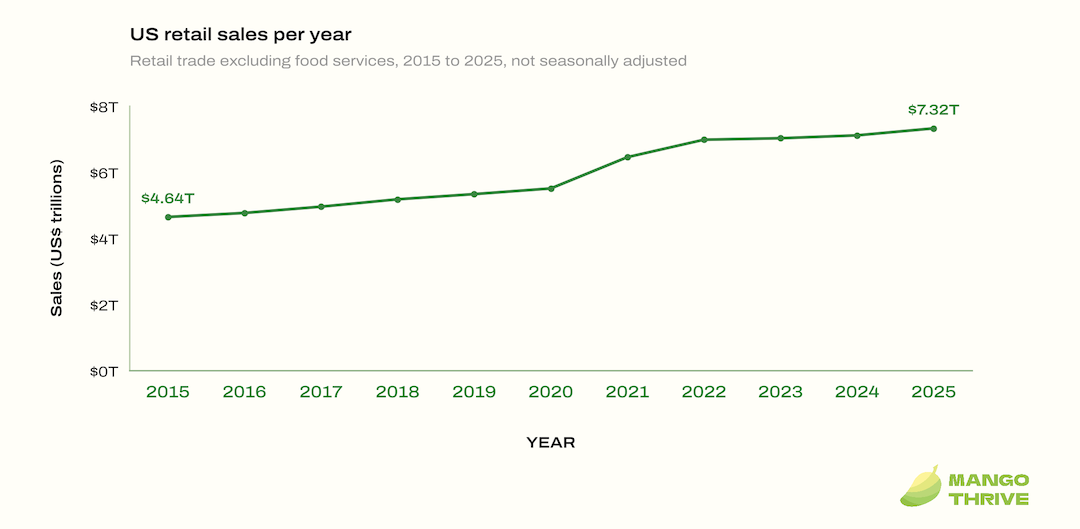
US retail sales per year, 2015 to 2025, excluding food services
Source: U.S. Census Bureau, Monthly Retail Trade, not seasonally adjusted.
Retail Sales by Category
These figures break US retail sales down by kind of business, using the Census Bureau’s own groupings and names.
8. Motor vehicle and parts dealers sold $1.62 trillion in the U.S. in 2025 (U.S. Census Bureau, Monthly Retail Trade).
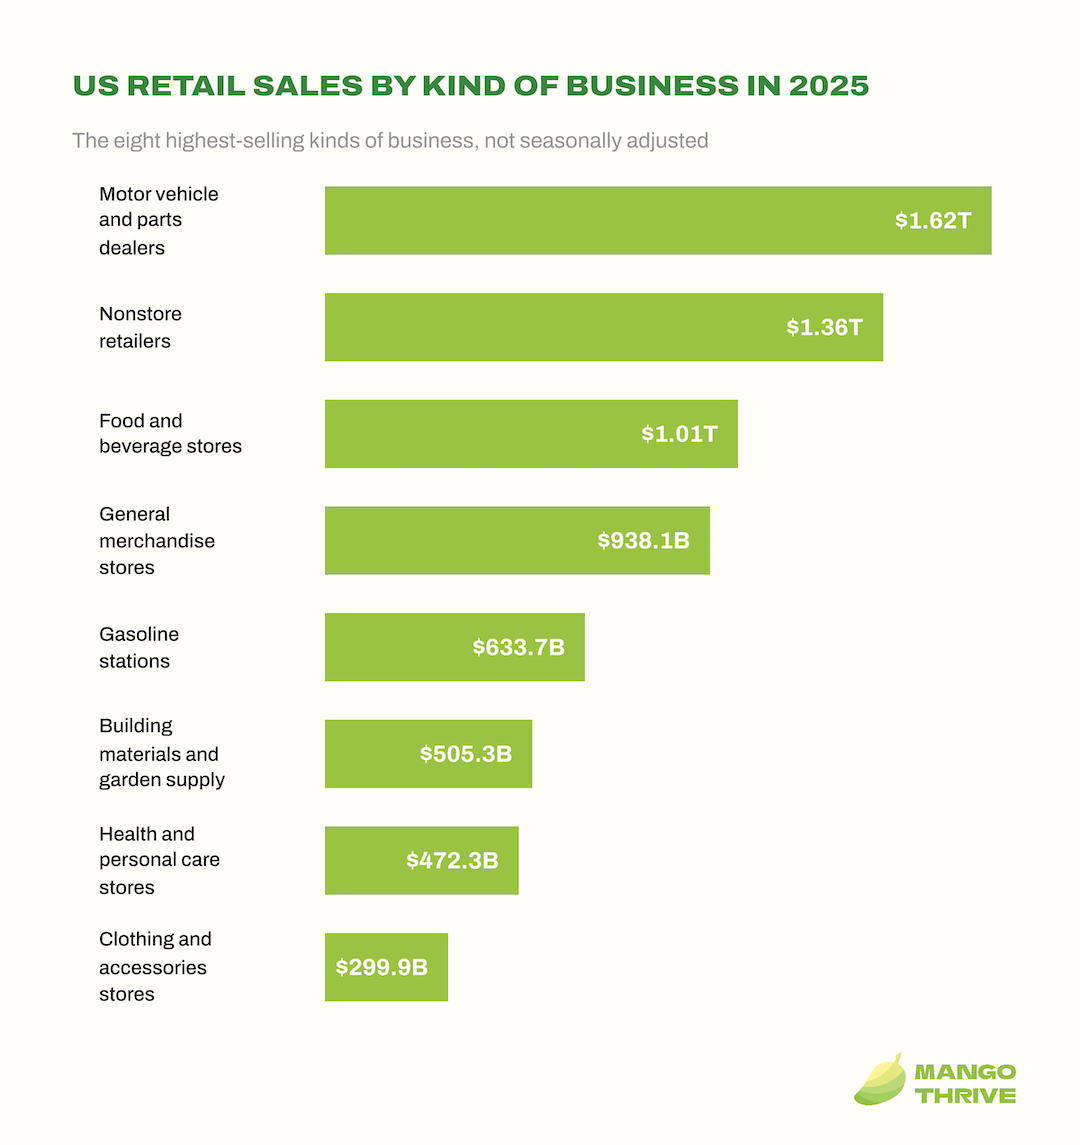
US retail sales by kind of business in 2025, the eight highest-selling kinds
Source: U.S. Census Bureau, Monthly Retail Trade, not seasonally adjusted.
9. Nonstore retailers sold $1.36 trillion in the U.S. in 2025 (U.S. Census Bureau, Monthly Retail Trade). Electronic shopping and mail-order houses made up $1.28 trillion of that.
10. Food and beverage stores sold $1.01 trillion in the U.S. in 2025 (U.S. Census Bureau, Monthly Retail Trade). Grocery stores accounted for $911.3 billion of that.
11. General merchandise stores sold $938.1 billion in the U.S. in 2025 (U.S. Census Bureau, Monthly Retail Trade). Warehouse clubs and supercenters accounted for $787.4 billion of that.
12. Gasoline stations sold $633.7 billion in the U.S. in 2025 (U.S. Census Bureau, Monthly Retail Trade).
13. Building materials and garden supply dealers sold $505.3 billion in the U.S. in 2025 (U.S. Census Bureau, Monthly Retail Trade). Health and personal care stores sold $472.3 billion, and clothing and accessories stores $299.9 billion.
14. U.S. food services and drinking places generated $1.03 trillion in sales in 2025 (U.S. Census Bureau, Monthly Retail Trade).
In Census retail surveys, “gross margin” means total sales minus the cost of the goods sold.
15. U.S. retailers earned $2.41 trillion in gross margin in 2024, on $7.11 trillion in sales (U.S. Census Bureau, Annual Integrated Economic Survey).
16. U.S. retailers held $830.2 billion in inventories at the end of 2024 (U.S. Census Bureau, Annual Integrated Economic Survey).
How Many Retail Stores and Businesses Are There?
These figures count US retail locations and companies, plus store openings, closures and empty retail space. An establishment is a single physical location.
17. The U.S. had 1,043,373 retail establishments with paid employees in 2023 (U.S. Census Bureau, County Business Patterns). Of these, 457,825 had fewer than five employees.
18. The U.S. had 645,404 retail firms with paid employees in 2022 (U.S. Census Bureau, Statistics of U.S. Businesses). Together they operated 1,045,890 establishments.
19. 194 U.S. retail firms had 20,000 or more employees in 2022 (U.S. Census Bureau, Statistics of U.S. Businesses).
20. Nearly 5,300 new U.S. stores opened in 2025, according to Coresight Research’s store tracker (Coresight Research, Weekly US Store Openings and Closures Tracker 2025, Week 53).
21. 3,321 U.S. store closures were tracked by Coresight Research in the first half of 2026, down 44.1% year over year (Coresight Research via Retail TouchPoints).
22. 3,215 U.S. store openings were tracked by Coresight Research in the first half of 2026 (Coresight Research via Retail TouchPoints). Closures still outnumbered openings by 106 stores.
23. 10 retail bankruptcies were tracked by Coresight Research in the first half of 2026, versus 32 a year earlier (Coresight Research via Retail TouchPoints).
24. The U.S. retail vacancy rate was 6.0% in Q2 2026, per Cushman & Wakefield (Cushman & Wakefield, U.S. Retail MarketBeat Q2 2026). Its historical average is 7.4%.
25. $25.65 per square foot was the U.S. retail asking rent in Q2 2026, up 2.2% year over year (Cushman & Wakefield, U.S. Retail MarketBeat Q2 2026).
Largest Retailers Statistics
These figures come from Deloitte’s ranking of global retailers, from company filings and from NRF’s list of US retailers.
26. $6.03 trillion was the combined retail revenue of the world’s 250 largest retailers in fiscal 2023 (Deloitte, Global Powers of Retailing 2025).
In Deloitte’s Global Powers of Retailing, “composite” growth is weighted by each retailer’s sales and adjusted for currency.
27. 3.6% was the composite retail revenue growth of the Top 250 global retailers in fiscal 2023 (Deloitte, Global Powers of Retailing 2025).
28. 34.9% of the Top 250 retailers’ revenue went to the 10 largest in fiscal 2023 (Deloitte, Global Powers of Retailing 2025).
29. 49.2% of Top 250 retail revenue came from North American retailers in fiscal 2023 (Deloitte, Global Powers of Retailing 2025). The region had 85 of the 250 companies.
30. $713.2 billion was Walmart’s total revenue in fiscal 2026, which ended January 31, 2026 (Walmart, Form 10-K fiscal 2026).
31. About 280 million customers shop Walmart each week, in more than 10,900 stores in 19 countries and on its e-commerce websites and apps (Walmart, Form 10-K fiscal 2026).
32. 4,611 Walmart U.S. stores generated $483.0 billion in net sales in fiscal 2026 (Walmart, Form 10-K fiscal 2026). That was 68% of Walmart’s consolidated net sales.
33. About 2.1 million people work for Walmart worldwide, including about 1.6 million in the U.S. (Walmart, Form 10-K fiscal 2026).
In Amazon’s filings, “online stores” covers product and digital media sales that Amazon records at their full sale value.
34. $269.3 billion in Amazon net sales came from its online stores in 2025 (Amazon, Form 10-K 2025).
35. $172.2 billion came from third-party seller services at Amazon in 2025 (Amazon, Form 10-K 2025). These are commissions and fulfillment and shipping fees paid by sellers.
36. $22.6 billion in Amazon net sales came from its physical stores in 2025 (Amazon, Form 10-K 2025). Online orders picked up in its stores are not counted here.
37. $297.2 billion in net sales was reported by Costco for fiscal 2026, up 10.1% (Costco, Q4 and fiscal 2026 results). Its fiscal year ended August 30, 2026.
38. 939 Costco warehouses were operating as of September 24, 2026, including 647 in the U.S. and Puerto Rico (Costco, Q4 and fiscal 2026 results).
39. 84.1 million paid Costco memberships were reported for the fourth quarter of fiscal 2026, up 3.8% (Costco, Q4 fiscal 2026 supplemental information). These covered 150.4 million cardholders.
40. 89.8% of Costco members worldwide renewed, per its Q4 fiscal 2026 report (Costco, Q4 fiscal 2026 supplemental information). The rate was 92.3% in the U.S./Canada.
41. $104.8 billion in net sales was reported by Target for fiscal 2025, down 1.7% (Target, Form 10-K fiscal 2025). It had 1,995 stores as of January 31, 2026.
In NRF’s Top 100 list, “U.S. retail sales” are Kantar’s estimates of each company’s U.S. retail sales.
42. $293.85 billion in U.S. retail sales made Amazon No. 2 on NRF’s 2026 Top 100 Retailers list (NRF, 2026 Top 100 Retailers). Kantar compiled the 2025 sales figures.
43. Costco ranked No. 3 on NRF’s 2026 Top 100 with $198.73 billion in 2025 U.S. retail sales, up 8.7% (NRF, 2026 Top 100 Retailers).
What Share of Retail Sales Happen Online?
These figures cover e-commerce in the US, from Census Bureau estimates, Walmart and Target filings, and Adobe’s holiday data.
44. 17.1% of U.S. retail sales were made online in Q2 2026, seasonally adjusted (U.S. Census Bureau, Quarterly Retail E-Commerce Sales).
45. $340.2 billion in U.S. retail e-commerce sales were estimated for Q2 2026, seasonally adjusted and preliminary (U.S. Census Bureau, Quarterly Retail E-Commerce Sales). That was up 3.8% from the first quarter of 2026.
46. U.S. e-commerce sales grew an estimated 12.2% year over year in Q2 2026, while total retail sales grew 6.7%, seasonally adjusted (U.S. Census Bureau, Quarterly Retail E-Commerce Sales).
47. $1.23 trillion in U.S. retail e-commerce sales in 2025, the sum of the four quarterly Census estimates, not seasonally adjusted (U.S. Census Bureau, Quarterly Retail E-Commerce Sales time series, not adjusted).
48. 18.3% of U.S. retail sales were made online in Q4 2025, before seasonal adjustment (U.S. Census Bureau, Quarterly Retail E-Commerce Sales).
49. 6.9% of U.S. retail sales were made online in Q1 2015, seasonally adjusted (U.S. Census Bureau, Quarterly Retail E-Commerce Sales time series).
50. 16.3% of U.S. retail sales were online in Q2 2020, up from 11.9% in Q1 2020, seasonally adjusted (U.S. Census Bureau, Quarterly Retail E-Commerce Sales time series).
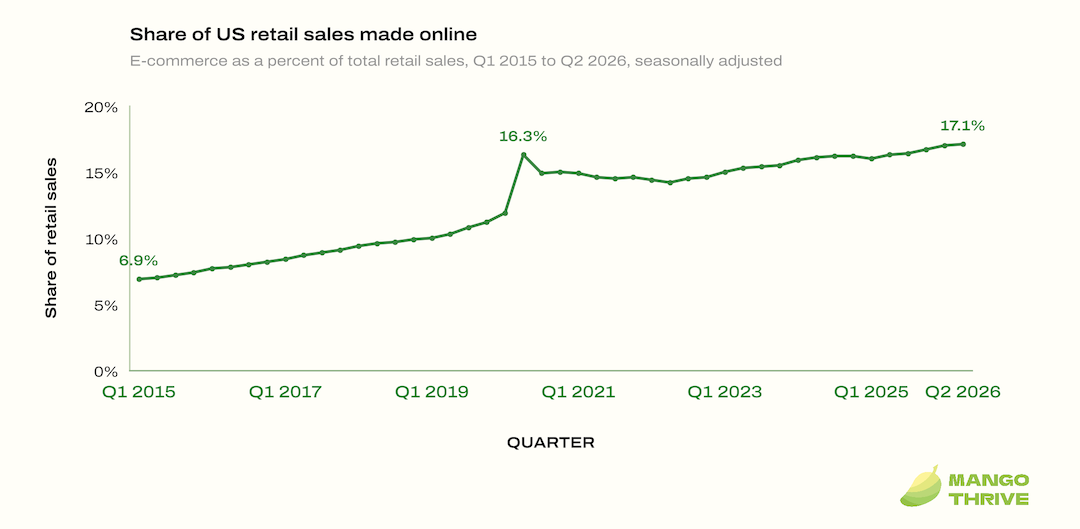
E-commerce as a share of US retail sales by quarter, Q1 2015 to Q2 2026, seasonally adjusted
Source: U.S. Census Bureau, Quarterly Retail E-Commerce Sales time series, seasonally adjusted.
51. 21.6% was the year-over-year growth in e-commerce sales at U.S. general merchandise retailers in Q2 2026 (U.S. Census Bureau, Quarterly Retail E-Commerce supplemental tables). The figures are not seasonally adjusted.
In Walmart’s filings, “eCommerce” sales include online orders fulfilled from stores, plus some advertising, fulfillment and data services.
52. About $99.6 billion of Walmart U.S. net sales came from e-commerce in fiscal 2026 (Walmart, Form 10-K fiscal 2026). That figure was $79.3 billion a year earlier.
In Target’s filings, “digitally originated” sales are purchases started on Target’s apps or websites, even if picked up or shipped from a store.
53. 20.6% of Target’s merchandise sales were digitally originated in fiscal 2025 (Target, Form 10-K fiscal 2025). Its stores fulfilled 97.6% of merchandise sales.
54. $257.8 billion was spent online by U.S. consumers from November 1 to December 31, 2025, up 6.8% year over year (Adobe, 2025 holiday shopping season). Adobe measures transactions on U.S. retail sites through Adobe Analytics.
55. 56.4% of U.S. online holiday transactions in 2025 were made on a smartphone, up from 54.5% in 2024 (Adobe, 2025 holiday shopping season).
56. $20 billion in U.S. online holiday spending in 2025 was paid with buy now, pay later, up 9.8% year over year (Adobe, 2025 holiday shopping season).
Online Shopping Around the World
These figures come from national statistics agencies and ministries. Each country measures online sales in its own way.
57. 7.5% of Canadian retail trade was e-commerce in July 2026, seasonally adjusted (Statistics Canada, Retail trade, July 2026). Online retail sales totaled C$5.5 billion that month.
58. 28.8% of retail sales in Great Britain, excluding automotive fuel, were made online in August 2026, seasonally adjusted (Office for National Statistics, Retail sales, Great Britain: August 2026).
59. 10.2% of sales at predominantly food stores in Great Britain were made online in August 2026, seasonally adjusted (Office for National Statistics, Retail Sales Index internet sales).
60. 36.1% of retail sales in Great Britain, excluding automotive fuel, were made online in January 2021, up from 19.5% in January 2020, seasonally adjusted (Office for National Statistics, Retail Sales Index internet sales).
61. 8,419.5 billion yuan in online retail sales of goods in China from January to August 2026, up 4.3% year on year (National Bureau of Statistics of China).
62. 26.1% of China’s retail sales of consumer goods in 2025 were online sales of physical goods (National Bureau of Statistics of China, 2025 Statistical Communiqué). That came to 13,092.3 billion yuan, up 5.2% from 2024.
63. 26.1 trillion yen was the size of Japan’s consumer e-commerce market in 2024, up 5.1% from 2023 (Ministry of Economy, Trade and Industry, Japan).
64. 9.8% of consumer goods commerce in Japan was done online in 2024, up 0.4 points from 2023 (Ministry of Economy, Trade and Industry, Japan). METI calculates this rate for the goods segment only.
65. 62% of people aged 16 to 74 in the EU bought something online in the previous three months, 2025 (Eurostat, Internet purchases by individuals).
Retail Returns Statistics
These figures come from the annual returns report by NRF and Happy Returns, based on surveys of retailers and shoppers.
66. Retailers estimated that $849.9 billion in merchandise, or 15.8% of annual sales, would be returned in 2025 (NRF and Happy Returns, 2025 Retail Returns Landscape). The survey covered 358 e-commerce professionals at large U.S. merchants.
67. 19.3% of online sales were expected to be returned in 2025, the report estimated (NRF and Happy Returns, 2025 Retail Returns Landscape).
68. 9% of all retail returns are fraudulent, the same report found (NRF and Happy Returns, 2025 Retail Returns Landscape).
69. 82% of online shoppers who made a return said free returns are a major consideration when buying, up from 76% in 2024 (NRF and Happy Returns, 2025 Retail Returns Landscape). The survey covered 2,006 consumers who returned an online purchase in the past 12 months.
How Many People Work in Retail?
These figures count retail jobs in the US, Canada and the EU. Retail salespersons and cashiers are counted across all industries unless the sentence says otherwise.
70. 15.48 million people worked in US retail trade in September 2026, seasonally adjusted (BLS, Current Employment Statistics). The September figure is preliminary.
71. 15.44 million people worked in US retail trade on average in 2025 (BLS, Current Employment Statistics, annual averages).
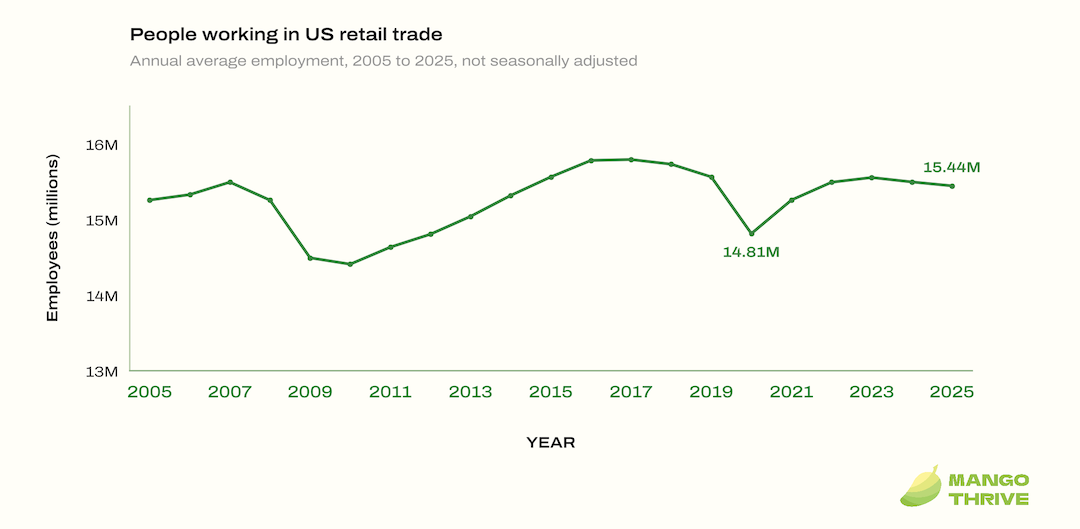
People working in US retail trade, annual average employment, 2005 to 2025
Source: BLS, Current Employment Statistics, annual averages, not seasonally adjusted.
72. 14.81 million people worked in US retail trade on average in 2020, down from 15.56 million in 2019 (BLS, Current Employment Statistics, annual averages).
73. 3.55 million retail salespersons worked in the US retail trade industry in 2025 (BLS, Industries at a Glance: Retail Trade). The industry also employed 2.55 million cashiers and 1.83 million stock clerks and order fillers.
74. 3.9 million Americans worked as retail salespersons in May 2025, behind only home health and personal care aides (BLS, Occupational Employment and Wages Summary). Fast food and counter workers matched that 3.9 million.
75. 3.09 million Americans worked as cashiers in May 2025, earning a median $15.81 an hour (BLS, OEWS Table 1).
76. 7.68 million Americans held retail sales jobs in May 2025, a BLS group covering cashiers, retail salespersons, and counter and rental clerks and parts salespersons (BLS, OEWS Table 1).
77. 2.26 million people worked in Canadian retail trade in August 2026, seasonally adjusted (Statistics Canada, Table 14-10-0355-01).
78. 803,900 Canadian retail trade workers held part-time jobs in 2025, out of 2.27 million employed in the industry (Statistics Canada, Table 14-10-0023-01). Of those employed, 654,800 were aged 15 to 24.
79. 16.6 million people worked in retail trade across the EU in 2024, at 3.29 million retail enterprises (Eurostat, SBS by NACE activity). Retail here excludes motor vehicles and motorcycles.
How Much Do Retail Workers Earn?
These BLS figures cover hourly pay in US retail. BLS also reports pay for production and nonsupervisory employees, a group that leaves out higher-level managers.
80. $26.38 was the average hourly pay of US retail workers in September 2026, up from $25.63 a year earlier (BLS, Current Employment Statistics, average hourly earnings). The figure covers all employees and is preliminary and seasonally adjusted.
81. $22.63 was the average hourly pay of US retail production and nonsupervisory employees in September 2026 (BLS, Current Employment Statistics, production and nonsupervisory earnings). The figure is preliminary and seasonally adjusted.
82. $17.03 was the median hourly wage of US retail salespersons in May 2025 (BLS, OEWS Table 1). Their mean annual wage was $37,310.
83. 1.12 million Americans worked as first-line supervisors of retail sales workers in May 2025, with a median wage of $23.33 an hour (BLS, OEWS Table 1).
Retail Jobs: Openings, Quits, Benefits and Outlook
These BLS figures cover job openings, people quitting, union membership, benefits and the ten-year job outlook in US retail.
84. 761,000 retail job openings were open in the US in August 2026, a rate of 4.7% (BLS, JOLTS Table 1). The August figure is preliminary and seasonally adjusted.
85. 464,000 US retail workers quit their jobs in August 2026, a quits rate of 3.0% (BLS, JOLTS Table 4). That compares with a 2.4% rate in August 2025, and the August 2026 figure is preliminary and seasonally adjusted.
86. 4.0% of US retail trade wage and salary workers were union members in 2025 (BLS, Union Members Table 3). The 2025 estimate averages 11 months and excludes October.
87. 57% of private-industry retail trade workers had access to employer healthcare benefits in 2026 (BLS, National Compensation Survey, healthcare benefits).
88. 74% of private-industry retail trade workers had access to paid sick leave in 2026, up from 65% in 2020 (BLS, National Compensation Survey, paid sick leave).
89. 72% of private-industry retail trade workers had access to paid vacation in 2026, and 78% had access to retirement benefits (BLS, Industries at a Glance: Retail Trade).
90. 6.5% decline is projected in US cashier employment from 2025 to 2035, a loss of about 200,600 jobs (BLS, Employment Projections). BLS projects an average of 521,300 cashier openings each year.
91. 0.3% decline is projected in US retail salesperson employment from 2025 to 2035 (BLS, Employment Projections). BLS projects an average of 520,600 openings a year for the job.
Retail Theft and Shrink Statistics
These figures come from NRF surveys of retailers’ loss prevention and security executives.
In the NRF survey, “shrink” means inventory losses a retailer records over a period, from theft, process mistakes and system errors, measured as a share of sales (NRF, National Retail Security Survey 2023).
92. 1.6% of sales was the average retail shrink rate in fiscal 2022, equal to $112.1 billion in US losses (NRF, National Retail Security Survey 2023).
93. 36% of retail shrink came from external theft in fiscal 2022, on average, versus 29% from employee theft (NRF, National Retail Security Survey 2023). Process and control failures accounted for 27%.
In NRF’s theft survey, “shoplifting” counts events where a retailer knows a person tried to steal or stole goods without paying, while “merchandise theft” covers any recorded loss the retailer attributes to theft.
94. Surveyed retailers that tracked theft saw 12.4% fewer shoplifting incidents in 2025 than in 2024, on average (NRF, The Impact of Retail Theft & Violence 2026). Merchandise theft incidents fell 8.1%.
95. 69% of surveyed retailers reported an increase in phone scams in 2025 (NRF, The Impact of Retail Theft & Violence 2026). 51% reported more loyalty fraud and 42% more gift card theft or fraud.
96. 63% of surveyed retailers reported fewer than half of their store theft incidents to law enforcement (NRF, The Impact of Retail Theft & Violence 2026). The top reasons were low dollar losses (60%) and lack of law enforcement response (54%).
97. 65% of surveyed retailers made adjustments to their stores in 2024 because of theft, violence or other crime (NRF, Impact of Retail Theft & Violence 2025). 20% closed store locations.
How Many Retailers Use AI?
These figures come from government business surveys in the US, the EU and Canada. Each survey asks a different question, so the numbers are not directly comparable.
98. 16.5% of U.S. retail businesses used AI in a business function in the survey collected Sept. 7–20, 2026 (U.S. Census Bureau, Business Trends and Outlook Survey). Businesses were asked about AI use in the last two weeks.
99. U.S. retail businesses using AI rose from 12.5% in the survey collected Nov. 17–30, 2025 to 16.5% in Sept. 2026 (U.S. Census Bureau, Business Trends and Outlook Survey).
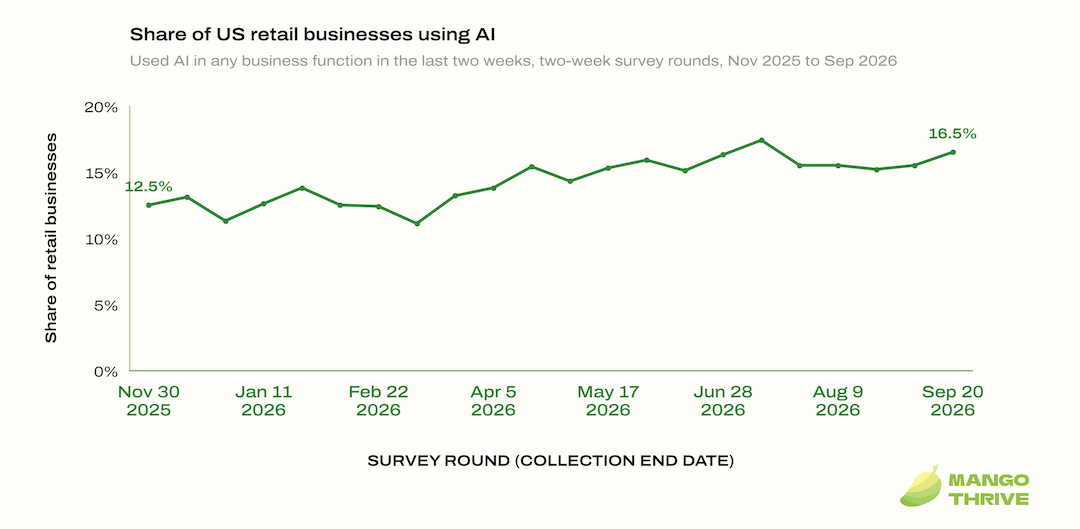
Share of US retail businesses using AI in any business function, two-week survey rounds, November 2025 to September 2026
Source: U.S. Census Bureau, Business Trends and Outlook Survey, retail trade sector, not seasonally adjusted.
100. 23.8% of all U.S. businesses used AI in a business function in the Sept. 7–20, 2026 survey (U.S. Census Bureau, Business Trends and Outlook Survey).
101. 19.6% of U.S. retail businesses expected to use AI in the next six months, per a Sept. 2026 survey (U.S. Census Bureau, Business Trends and Outlook Survey).
102. 15.46% of EU retail enterprises with 10 or more persons employed used at least one AI technology in 2025 (Eurostat).
103. EU retail enterprises with 10 or more persons employed using AI rose from 6.0% in 2021 to 15.46% in 2025 (Eurostat).
104. 7.45% of EU retail enterprises with 10 or more persons employed used AI for marketing or sales in 2025 (Eurostat).
105. 32.14% of Danish retail enterprises with 10 or more persons employed used AI in 2025, the highest share in Eurostat’s country data (Eurostat). Romania had the lowest at 1.73%.
106. 19.2% of Canadian retail businesses used AI to produce goods or deliver services in the 12 months before a survey collected April 1 to May 6, 2026 (Statistics Canada, Table 33-10-1167-01).
107. 6.6% of Canadian retail businesses used AI to produce goods or deliver services in the 12 months before a survey collected April 1 to May 5, 2025 (Statistics Canada, Table 33-10-1004-01).
How Retailers Use AI
These figures cover what retailers use AI for, how shoppers reach retail sites through AI tools and what AI agents may do next. AI traffic means shoppers who click through to a retail site from an AI tool. Agentic AI means AI that can take actions on its own, such as placing an order.
108. 64% of retail executives said their company already uses AI for fraud detection and cybersecurity, in Deloitte’s 2026 outlook survey (Deloitte, 2026 Retail Industry Global Outlook). Deloitte surveyed 330 executives in October and November 2025.
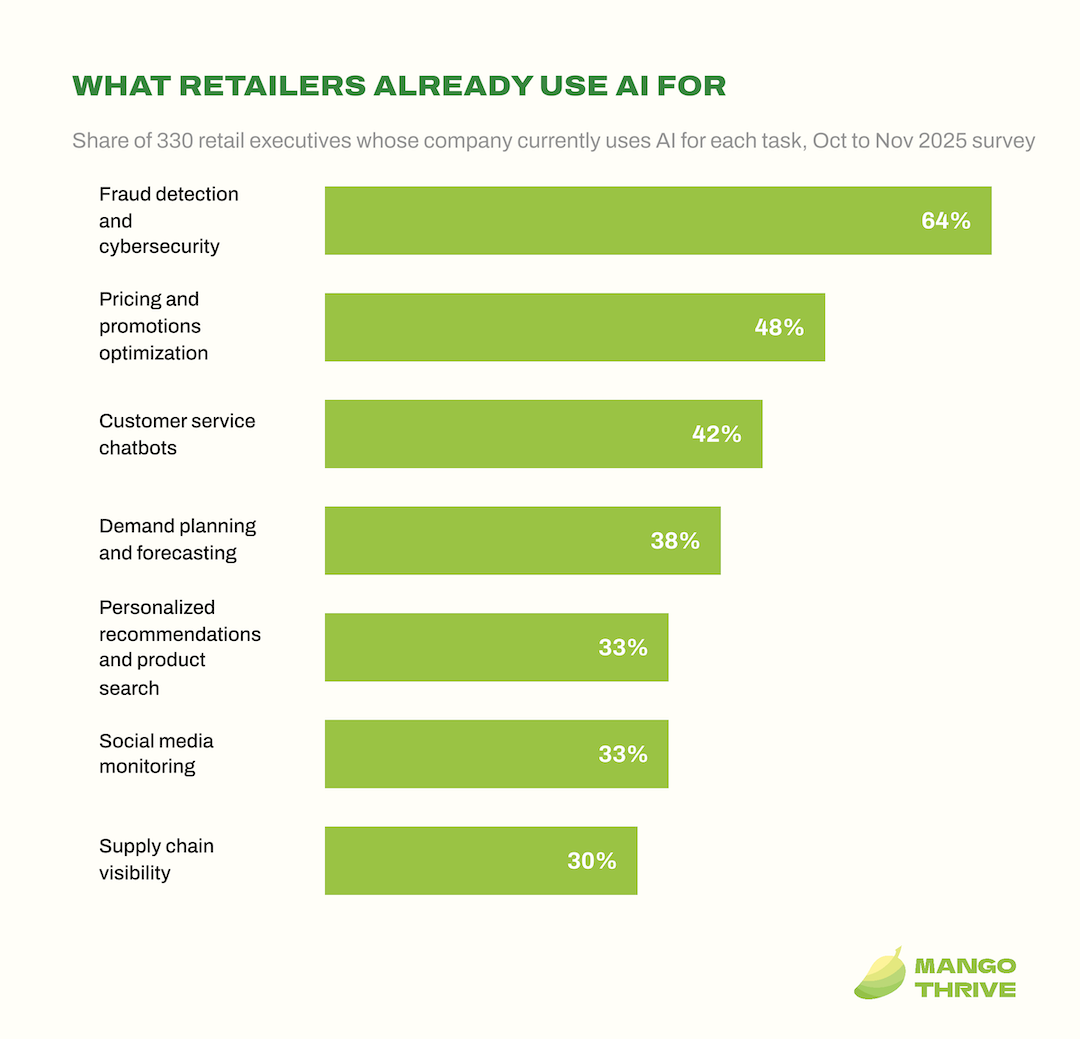
What retail executives say their company already uses AI for, Deloitte 2026 survey of 330 executives
Source: Deloitte, 2026 Retail Industry Global Outlook, p. 9.
109. 42% of retail executives surveyed in late 2025 said their company uses AI customer service chatbots (Deloitte, 2026 Retail Industry Global Outlook).
110. Nearly 68% of retail executives surveyed in late 2025 expect to deploy agentic AI within 12 to 24 months (Deloitte, 2026 Retail Industry Global Outlook).
111. 44% of retail executives surveyed in late 2025 said legacy systems are slowing down innovation at their company (Deloitte, 2026 Retail Industry Global Outlook).
112. 39% of U.S. consumers said they had used AI for online shopping, in an Adobe survey published April 2026 (Adobe, AI traffic to retail sites). The survey covered more than 5,000 U.S. respondents.
113. Traffic from generative AI tools to U.S. retail sites rose 693.4% year over year in the 2025 holiday season (Adobe, 2025 holiday shopping season release). Adobe defined the season as Nov. 1 to Dec. 31.
114. Traffic from AI sources to U.S. retail sites grew 393% year over year in January to March 2026 (Adobe, AI traffic to retail sites).
115. AI traffic to U.S. retail sites converted 42% better than non-AI traffic in March 2026 (Adobe, AI traffic to retail sites). In March 2025, it converted 38% worse.
116. Shoppers referred by AI-powered search converted nine times more often than social media referrals in the 2025 holiday season (Salesforce).
117. Agentic commerce could orchestrate $900 billion to $1 trillion of U.S. B2C retail revenue by 2030, McKinsey estimates (McKinsey). Globally, McKinsey projects a range of $3 trillion to $5 trillion.
118. More than 300 million customers have used Amazon’s Rufus AI shopping assistant, Amazon said in February 2026 (Amazon Q4 2025 results). Amazon said Rufus helped deliver nearly $12 billion in incremental annualized sales in 2025.
Retail Media Statistics
Retail media means advertising that retailers sell. These figures come from Amazon’s and Walmart’s own reports.
119. $68.6 billion in advertising services revenue was reported by Amazon for 2025 (Amazon, Form 10-K 2025).
120. Amazon’s advertising services revenue reached $19.8 billion in Q2 2026 (Amazon Q2 2026 results). It grew 26% year over year, excluding foreign exchange.
121. Walmart’s global advertising business grew 38% in its quarter ended July 31, 2026 (Walmart Q2 FY27 earnings). Walmart Connect in the U.S. grew 43%, excluding VIZIO.
Retail Industry Statistics by Country
These figures come from national statistics agencies. Each keeps its own currency and its own way of measuring, and sales volume means sales adjusted for price changes.
122. 50,120.2 billion yuan of consumer goods were sold at retail in China in 2025, up 3.7% from 2024 (National Bureau of Statistics of China, 2025 Statistical Communiqué). The total includes catering income.
123. 32,756.9 billion yuan in retail sales of consumer goods were recorded in China from January to August 2026, up 1.1% year on year (National Bureau of Statistics of China). The growth rate is not adjusted for price changes.
In China’s official statistics, retailers “above the designated size” are those with annual main business revenue of at least 5 million yuan.
124. 5.5% was the January–August 2026 sales growth for convenience stores among China’s retail enterprises above the designated size (National Bureau of Statistics of China). Department store sales fell 3.0%, brand-exclusive stores fell 10.0%, and supermarkets grew 3.8%.
125. 13.9% was the drop in motor vehicle sales among China’s retail enterprises above the designated size in January–August 2026, while telecom equipment sales rose 16.3% (National Bureau of Statistics of China).
126. 1.0% was the year-on-year rise in EU retail trade volume in July 2026, versus 0.6% in the euro area (Eurostat, Euro indicators). The figures are calendar adjusted.
127. 8.6% was Cyprus’s year-on-year retail volume growth in July 2026, the highest among reporting EU countries in Eurostat’s first estimate (Eurostat, Euro indicators). Germany’s volume fell 2.5% in that estimate.
128. 2.5% was the growth in EU retail trade volume in 2025, calendar adjusted (Eurostat, sts_trtu_a). The euro area also grew 2.5%.
129. €3.54 trillion was the net turnover of EU retail enterprises in 2024 (Eurostat, Structural business statistics).
130. 2.4% was the year-on-year rise in Great Britain’s retail sales volumes in August 2026, seasonally adjusted (Office for National Statistics, Retail sales, Great Britain: August 2026). Volumes rose 0.5% from July.
131. 1.1% was the growth in Great Britain’s retail sales volumes in 2025 (Office for National Statistics, Retail Sales Index reference tables).
132. $73.7 billion (CAD) in retail sales were recorded in Canada in July 2026, down 0.7% from June, seasonally adjusted (Statistics Canada, The Daily). Sales fell in eight of nine subsectors.
133. $843.6 billion (CAD) in retail sales were recorded in Canada in 2025, the sum of 12 unadjusted monthly figures in Statistics Canada’s table (Statistics Canada, Table 20-10-0056-01).
134. ¥157.5 trillion in retail sales were recorded in Japan in 2025, up 1.4% from 2024 (METI, Current Survey of Commerce).
135. 2.7% was the year-on-year rise in Japan’s retail sales in August 2026, to ¥13,052 billion, in METI’s preliminary report (METI, Current Survey of Commerce).
136. 1.2% was the year-on-year rise in Brazil’s retail sales volume in July 2026 (IBGE, Monthly Retail Survey, table 8880). Volume fell 0.8% from June, seasonally adjusted.
137. 1.6% was the growth in Brazil’s retail sales volume in 2025 (IBGE, Monthly Retail Survey, table 8880).
Conclusion
Retail sales keep rising, and a growing share of them happen online. Store-based retailers now sell online too, and the biggest ones run large e-commerce businesses of their own. AI now shows up in two places in the data: inside retailers’ operations and in how shoppers reach their sites. We’ll update this page as new data comes out.