
Generative AI is now part of work and life for many people. Chatbots draft emails, image models make pictures, and coding assistants write software. Behind them sit large sums of money, chips and data centers. Here are the statistics on who uses generative AI, how much is spent on it, what it produces and how far people trust it.
Top Generative AI Statistics
- 61.8% of U.S. adults aged 18–64 used generative AI as of May 2026 (GenAI Adoption Tracker (Bick, Blandin & Deming)).
- $170.9 billion in private investment went to generative AI companies worldwide in 2025 (Stanford HAI, 2026 AI Index Report, ch. 4).
- $37 billion was spent by companies on generative AI in 2025, Menlo Ventures estimates (Menlo Ventures, State of Generative AI in the Enterprise, Dec 2025).
- Anthropic’s run-rate revenue crossed $47 billion in May 2026 (Anthropic, Series H announcement).
- 75% of all new code at Google was AI-generated and approved by engineers in April 2026 (Google Cloud Next 2026).
- One in four jobs globally (24%) has some degree of GenAI exposure, the ILO’s 2025 refined index finds (ILO, Generative AI and Jobs: A Refined Global Index, 2025).
- 56% of employees in 47 countries say they have made mistakes in their work from AI use, a 2024–25 survey found (KPMG & University of Melbourne).
How Many Americans Use Generative AI?
The figures below come from the Real-Time Population Survey, a national survey of working-age Americans.
In the Real-Time Population Survey, a “generative AI user” is a US adult aged 18 to 64 who says they use generative AI for work, outside work, or both.
1. 61.8% of U.S. adults aged 18–64 used generative AI as of May 2026 (GenAI Adoption Tracker (Bick, Blandin & Deming)). The figure counts use for work, outside work, or both.
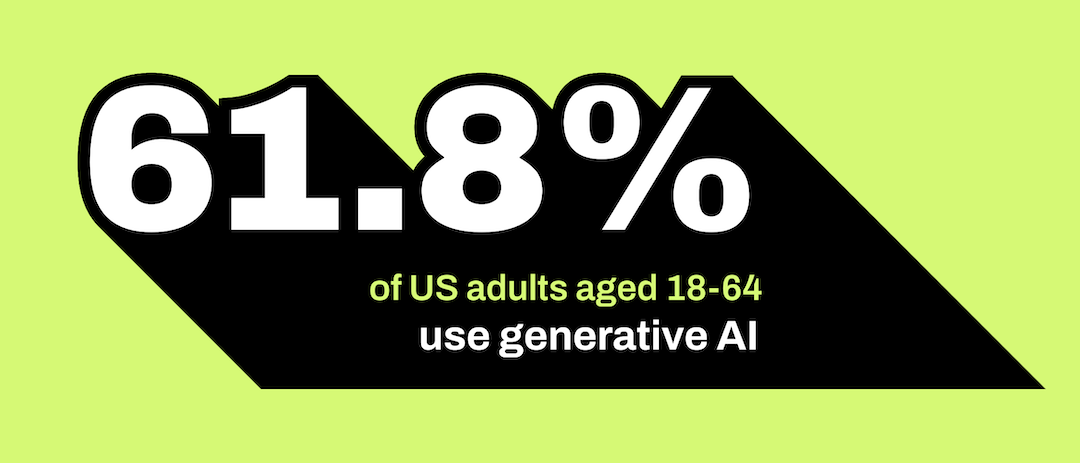
61.8% of US adults aged 18 to 64 use generative AI
Source: GenAI Adoption Tracker (Bick, Blandin & Deming)
2. 51.9% of U.S. adults aged 18–64 used generative AI in Q2 2025, rising to 61.8% in Q2 2026 (FRED, generative AI adoption rate).
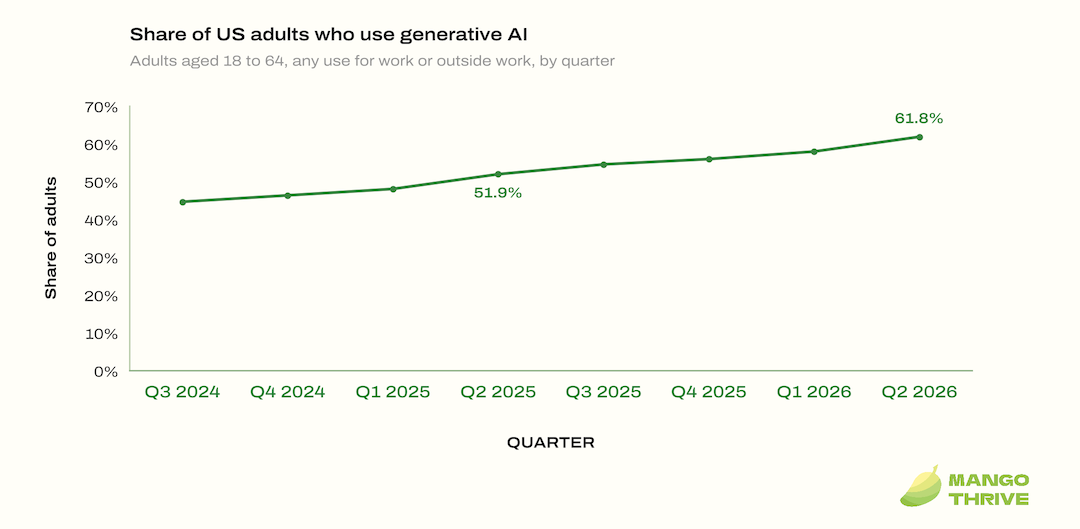
Line chart of the share of US adults who use generative AI by quarter
Source: FRED, generative AI adoption rate
3. 54.8% of U.S. adults aged 18–64 used generative AI outside of work in Q2 2026 (FRED, generative AI use outside work).
How Much Do Americans Use Generative AI for Work?
The same survey also asks how people use generative AI at work.
4. 45.2% of employed U.S. adults aged 18–64 used generative AI for work in May 2026 (GenAI Adoption Tracker (Bick, Blandin & Deming)).
5. 6.3% of work hours of employed U.S. adults aged 18–64 were spent using generative AI in May 2026 (GenAI Adoption Tracker (Bick, Blandin & Deming)).
In the Real-Time Population Survey, “time savings” means the extra hours workers say they would have needed last week without generative AI.
6. Generative AI saved 2.2% of work hours for employed U.S. adults aged 18–64 in May 2026, based on workers’ own estimates (GenAI Adoption Tracker (Bick, Blandin & Deming)). Non-users count as zero savings.
7. Generative AI took a third as long as personal computers to reach about 44% adoption among U.S. workers (GenAI Adoption Tracker (Bick, Blandin & Deming)).
Generative AI Use in Canada, the UK, and the EU
Government agencies elsewhere ask similar questions, with their own age ranges and time frames.
8. 35.9% of workers aged 15–69 in Canada’s provinces used generative AI tools at work in the 12 months to March 2026 (Statistics Canada, The Daily, July 30, 2026).
9. 31.4% of Canadian workers using generative AI used it daily in March 2026 (Statistics Canada, The Daily, July 30, 2026). Another 38.3% used it a few times per week.
10. 59% of UK adults aged 16 and over used generative AI in the last three months, a 2025/26 government survey found (DSIT Public Engagement Survey).
11. 75% of UK generative AI users used the tools at least weekly in 2025/26 (DSIT Public Engagement Survey). Some 35% used them at least daily. These results cover users who answered the survey online.
12. 32.7% of people aged 16–74 in the EU used generative AI tools in the last 3 months, per the 2025 survey (Eurostat, use of generative AI tools).
How Big Is the Generative AI Market?
Each research firm below sizes the market its own way.
13. US$394.66 billion is Statista’s modeled worldwide generative AI market value for 2026 (Statista Market Insights, Generative AI worldwide, 2026).
14. $2.3 trillion is Bloomberg Intelligence’s projected generative AI market size by 2032 (Bloomberg Intelligence, Generative AI 2026 Outlook press release).
15. $644 billion was Gartner’s forecast for worldwide generative AI spending in 2025, including hardware (Gartner, GenAI spending forecast, March 2025). The forecast covers services, software, devices and servers.
Agentic AI refers to AI systems that plan and carry out tasks on their own.
16. $286 billion in agentic AI spending is possible by 2032, Bloomberg Intelligence projects (Bloomberg Intelligence, Generative AI 2026 Outlook).
How Much Do Companies Spend on Generative AI?
Menlo Ventures tracks what companies spend on generative AI. Foundation models are large general-purpose AI models that other products are built on, and an API is how developers plug them into their own software.
In Menlo Ventures’ report, “generative AI spending” means spending on foundation models, model training, AI infrastructure, and AI apps, not chips, cloud inference, or AI features built into existing software.
17. $37 billion was spent by companies on generative AI in 2025, Menlo Ventures estimates (Menlo Ventures, State of Generative AI in the Enterprise, Dec 2025). This combines a survey of U.S. enterprise decision-makers with a bottoms-up market model.
In Menlo Ventures’ report, the “application layer” means the user-facing products and software built on top of AI models.
18. $19 billion of 2025 enterprise generative AI spending went to AI applications, per Menlo Ventures (Menlo Ventures, State of Generative AI in the Enterprise, Dec 2025).
19. $18 billion of 2025 enterprise generative AI spending went to the infrastructure layer, per Menlo Ventures (Menlo Ventures, State of Generative AI in the Enterprise, Dec 2025).
20. $12.5 billion of the $18 billion infrastructure layer went to foundation model APIs in 2025, Menlo Ventures estimates (Menlo Ventures, State of Generative AI in the Enterprise, Dec 2025).
21. $4.0 billion of 2025 enterprise generative AI spending went to coding tools, per Menlo Ventures (Menlo Ventures, State of Generative AI in the Enterprise, Dec 2025). That was 55% of departmental AI spending, a narrower Menlo category.
22. 76% of U.S. enterprise AI use cases were purchased rather than built in-house in 2025 (Menlo Ventures, State of Generative AI in the Enterprise, Dec 2025).
23. KPMG’s Q3 2026 survey of large U.S. companies put projected AI investment over the next 12 months at $173 million (KPMG, AI Quarterly Pulse Survey, Q3 2026). KPMG surveyed U.S. business leaders at companies with $1 billion+ revenue.
Large language models, or LLMs, are the AI systems behind chatbots like ChatGPT.
24. Enterprise leaders expected their LLM budgets to grow about 75% on average over the next year, a 2025 survey found (a16z, How 100 Enterprise CIOs Are Building and Buying Gen AI, June 2025). Andreessen Horowitz surveyed 100 CIOs across 15 industries.
Gartner forecasts spending on AI models and AI platforms.
25. $64 billion is projected worldwide end-user spending on AI models and platforms in 2026 (Gartner, AI platforms and models forecast, July 2026). Gartner projects this is up 63.4% from 2025.
26. Spending on all generative AI models worldwide, including specialized ones, is forecast to grow 117% in 2026, Gartner says (Gartner, AI platforms and models forecast, July 2026).
27. About $23.4 billion will go to foundation generative AI models worldwide in 2026, Gartner forecasts (Gartner, AI platforms and models forecast, July 2026).
How Much Money Goes Into AI and Generative AI Startups?
Stanford HAI reports generative AI companies separately as well as all AI companies. The other trackers count all AI companies, each in its own way.
In Stanford HAI’s AI Index, “private investment” means private funding, such as venture capital or private equity, for AI companies that have raised over $1.5 million since 2013.
In Stanford HAI’s AI Index, “generative AI” companies are companies with over $1.5 million in funding whose business descriptions and websites match generative AI keywords in Quid’s company database.
28. $170.9 billion in private investment went to generative AI companies worldwide in 2025 (Stanford HAI, 2026 AI Index Report, ch. 4). That was nearly half of all private AI investment that year.
29. $163.6 billion of US private AI investment in 2025 went to generative AI (Stanford HAI, 2026 AI Index Report, ch. 4). That was more than half of all US private AI investment.
30. $344.7 billion in private investment went to AI companies worldwide in 2025 (Stanford HAI, 2026 AI Index Report, ch. 4). That was up 127.5% from 2024.
31. 311 generative AI companies worldwide were newly funded in 2025 (Stanford HAI, 2026 AI Index Report, ch. 4).
In Crunchbase News reports, “AI” funding means rounds in Crunchbase’s AI industry categories, which reporters may expand with AI keyword matches.
32. $211 billion in global venture funding went to AI companies in 2025 (Crunchbase News, Jan. 7, 2026). Crunchbase says this was roughly half of all global venture funding that year.
33. $242 billion, or 80% of global venture funding, went to AI startups in Q1 2026 (Crunchbase News, Apr. 1, 2026).
34. $102 billion, or 64% of global venture capital, went to AI startups in Q3 2026 (Crunchbase News, Oct. 5, 2026).
In the PitchBook-NVCA Venture Monitor, “deal value” means equity investment into startups headquartered in the US.
35. $355.9 billion, or 86% of US venture deal value, went to AI companies in H1 2026 (PitchBook-NVCA Venture Monitor, Q2 2026).
36. $243.9 billion in venture capital went to AI startups worldwide in 2025, a record high (PitchBook, Q4 2025 AI VC Trends). That money went into 7,176 deals, well below the 2021 peak of 10,075.
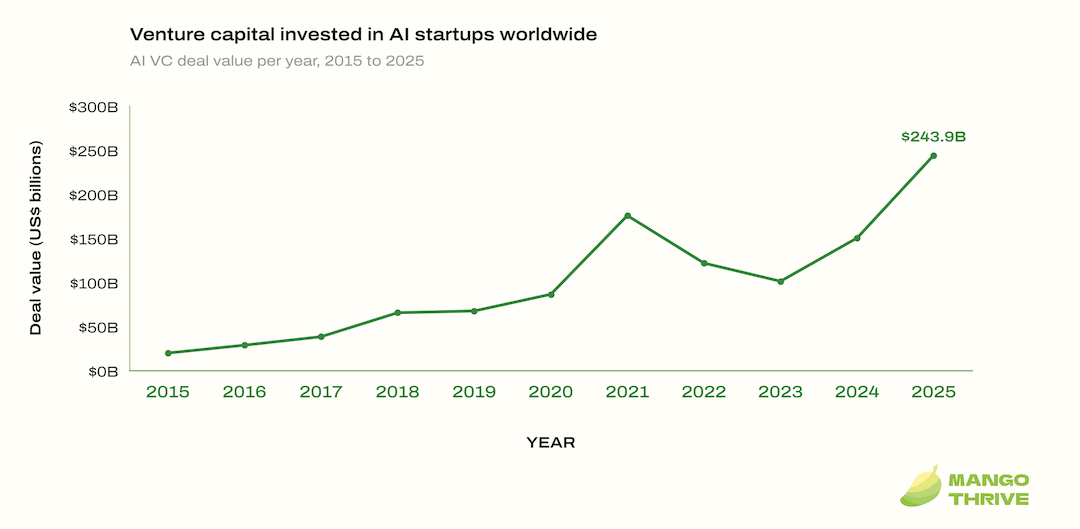
Line chart of venture capital invested in AI startups worldwide from 2015 to 2025
Source: PitchBook, Q4 2025 AI VC Trends
37. AI mergers and acquisitions totaled $142.5 billion worldwide in 2025, the highest on record (PitchBook, Q4 2025 AI VC Trends). That was across 808 deals.
A post-money valuation is a company’s value right after a funding round. Committed capital is money investors have promised to provide.
38. $122 billion in committed capital was raised in OpenAI’s March 2026 funding round, at an $852 billion post-money valuation (OpenAI, Mar. 31, 2026).
39. Anthropic raised $65 billion in Series H funding in May 2026, at a $965 billion post-money valuation (Anthropic, Series H announcement).
40. $20 billion was raised in xAI’s upsized Series E round, announced January 2026 (xAI, Jan. 6, 2026). The round exceeded its original target size.
41. Mistral AI raised €3 billion in Series D funding in September 2026, at a post-money valuation of more than €21 billion (Mistral AI, Sept. 8, 2026).
Big Tech Capital Spending and Nvidia Data Center Sales
The first three figures show spending on property and equipment, such as data centers and servers. Meta’s figure, defined below, also includes lease payments. All four are company totals, not AI alone.
42. $35.8 billion went to Microsoft’s additions to property and equipment in the April–June 2026 quarter (Microsoft FY26 Q4 earnings release).
43. $44.9 billion went to Alphabet’s purchases of property and equipment in Q2 2026 (Alphabet, Q2 2026 earnings release).
44. $54.2 billion went to Amazon’s purchases of property and equipment in Q2 2026 (Amazon Q2 2026 earnings release).
In Meta’s earnings release, “capital expenditures” means purchases of property and equipment plus principal payments on finance leases.
45. $31.08 billion went to Meta’s capital expenditures, including finance-lease principal payments, in Q2 2026 (Meta Q2 2026 earnings release).
Nvidia splits its data center sales between hyperscale customers, meaning the largest cloud providers, and other customers such as newer cloud providers and industrial and enterprise buyers.
46. Nvidia reported $89.0 billion in data center revenue in Q2 of fiscal 2027, up 117% year over year (Nvidia, Q2 FY2027 earnings release). Data center revenue also rose 18% from the previous quarter.
47. Nvidia reported $96.2 billion in total revenue for the quarter ended July 26, 2026, up 106% year over year (Nvidia, Q2 FY2027 earnings release).
48. $49 billion of Nvidia’s Q2 fiscal 2027 data center revenue came from hyperscale customers (Nvidia, Q2 FY2027 earnings call). Hyperscale revenue grew 13% from the prior quarter, which Nvidia attributed to sustained strength in Blackwell.
How Much Revenue Do Generative AI Companies Make?
OpenAI reports annualized recurring revenue (ARR), and Anthropic reports run-rate revenue. Both terms refer to a company’s current revenue pace projected over a full year.
49. OpenAI’s ARR reached more than $20 billion in 2025 (OpenAI, Sarah Friar blog). OpenAI cited $2 billion ARR in 2023 and $6 billion in 2024.
50. Anthropic’s run-rate revenue crossed $47 billion in May 2026 (Anthropic, Series H announcement).
51. More than 500 customers were spending over $1 million with Anthropic on an annualized basis as of February 2026 (Anthropic, Series G announcement).
52. Enterprise made up more than 40% of OpenAI’s revenue as of April 2026 (OpenAI, The next phase of enterprise AI). OpenAI expected enterprise to reach parity with consumer by end of 2026.
Tokens are small chunks of text that AI models read and write.
53. OpenAI’s APIs processed more than 15 billion tokens per minute as of April 2026 (OpenAI, The next phase of enterprise AI).
54. OpenAI had more than 9 million paying business users of ChatGPT in February 2026 (OpenAI, Scaling AI for everyone).
55. ChatGPT had more than 50 million consumer subscribers in February 2026 (OpenAI, Scaling AI for everyone).
56. OpenAI’s products reached 2.5 million businesses as of September 2026 (OpenAI, The Work Now Within Reach).
A seat is one paid user license.
57. Microsoft had over 30 million paid Microsoft 365 Copilot seats as of its fiscal Q4 2026 call (Microsoft, FY26 Q4 earnings call). Net seat adds more than doubled quarter over quarter.
58. GitHub Copilot had 50 million users as of July 2026, according to Microsoft (Microsoft, FY26 Q4 earnings call).
59. Microsoft’s AI app-and-agent platform Foundry had 100,000 customers in fiscal Q4 2026 (Microsoft, FY26 Q4 earnings call). Foundry revenue more than doubled year over year.
60. Google Cloud revenue rose 82% to $24.8 billion in Q2 2026 (Alphabet, Q2 2026 earnings release). Alphabet credited enterprise AI solutions, enterprise AI infrastructure and core cloud services.
Generative AI Model Statistics
These figures cover the models themselves: who builds them, how they compare and what they cost to train and use.
In Stanford HAI’s AI Index, “notable AI models” are models Epoch AI hand-picks using criteria such as being state of the art, historically significant, or highly cited.
61. 59 notable AI models came from the United States in 2025, versus 35 from China (Stanford HAI, 2026 AI Index Report (full PDF)). South Korea followed with 8, and new releases declined year over year across all major geographic areas.
62. 91.2% of notable AI models in 2025 were produced by industry (Stanford HAI, 2026 AI Index Report (full PDF)). Industry’s share has grown steadily over the past decade.
63. OpenAI released 20 notable AI models in 2025, more than any other organization (Stanford HAI, 2026 AI Index Report (full PDF)). Google (14) and Alibaba (11) followed.
64. Google has released 193 notable AI models since 2014, the largest number of any organization (Stanford HAI, 2026 AI Index Report (full PDF)). Meta and OpenAI rank second and third.
Open-weight models make their trained settings (weights) public for download. Closed-weight models keep them private.
65. 47 of 102 notable AI models in 2025 were released through API access (Stanford HAI, 2026 AI Index Report (full PDF)). API access was the most common release type, ahead of unrestricted open weights.
In Stanford HAI’s AI Index, the “Arena” score is a rating built from people voting between the answers of two AI models.
66. 49 points separated the top closed-weight and top open-weight models on the Arena leaderboard in March 2026 (Stanford HAI, 2026 AI Index Report (full PDF)). Claude Opus 4.6 scored 1,503 versus GLM‑5’s 1,454.
67. 39 points separated the top U.S. and top Chinese models on the Arena leaderboard in March 2026 (Stanford HAI, 2026 AI Index Report (full PDF)). Claude Opus 4.6 scored 1,503 versus Dola‑Seed‑2.0 Preview’s 1,464.
A context window is how much text a model can take in at once.
68. Context windows of large language models have grown almost 30x per year since mid-2023 (Stanford HAI, 2026 AI Index Report (full PDF)). Models that once accepted a few thousand tokens can now process 1 million or more.
In Epoch AI’s data, “FLOP” means floating-point operations, a measure of the computing work used to train a model.
69. Over 30 publicly announced AI models were estimated to have been trained with more than 10^25 FLOP as of June 2025, according to Epoch AI (Epoch AI, models over 1e25 FLOP). They came from 12 different AI developers.
In Epoch AI’s data, the “frontier” trend follows the top five models.
70. Training compute for frontier language models has grown 5x per year since 2020, Epoch AI estimates (Epoch AI, Trends in AI).
71. The cost to train frontier language models has risen 3.5x per year since 2020, Epoch AI estimates (Epoch AI, Trends in AI).
GPQA Diamond is a test of PhD-level science questions.
In Epoch AI’s analysis, “price” means U.S. dollars per million tokens, a 3:1 weighted average of input and output prices. The analysis tracks the cheapest model reaching a given score and leaves out reasoning models.
72. The price of GPT-4-level performance on PhD-level science questions fell 40x per year, Epoch AI found in March 2025 (Epoch AI, LLM inference price trends). Depending on the performance milestone, declines ranged from 9x to 900x per year.
73. $37.50 per million tokens bought GPT-4-level GPQA Diamond performance in March 2023, versus $0.12 by December 2024 (Epoch AI, LLM inference price trends).
74. More than 2 million public models were hosted on Hugging Face in 2025 (Hugging Face, State of Open Source Spring 2026). The platform also grew to 13 million users.
75. 41% of model downloads on Hugging Face went to Chinese models over the past year (Hugging Face, State of Open Source Spring 2026). China surpassed the U.S. in monthly and overall downloads.
How Much Content Does Generative AI Create?
Companies and researchers have started counting what AI tools produce, from web pages and images to songs and code.
76. 74.2% of new web pages contained AI-generated content in April 2025, according to Ahrefs (Ahrefs, AI-generated content study). Ahrefs analyzed 900,000 new English-language pages.
77. Only 2.5% of new web pages were classified as “pure AI” in Ahrefs’ April 2025 study (Ahrefs, AI-generated content study).
Common Crawl is a public archive of web pages.
78. By November 2024, AI-generated articles published on the web outnumbered human-written ones, per Graphite (Graphite, AI vs. human articles study). Graphite sampled English articles from Common Crawl and classified them with Surfer’s AI detector.
79. 39% of newly published English-language articles in Graphite’s sample were AI-generated 12 months after ChatGPT’s launch (Graphite, AI vs. human articles study).
80. Over 50 billion images had been generated with Google’s Nano Banana models by May 2026 (Google I/O 2026 keynote).
81. Over 700 million images were created in ChatGPT in the first week of its image generation feature in 2025 (OpenAI, image generation API announcement). More than 130 million users worldwide created them.
82. More than 24 billion assets had been created with Adobe Firefly models by June 2025 (Adobe, Firefly mobile app announcement, June 2025).
83. Over 150 million songs had been generated by Google’s Lyria 3 by April 2026, since its launch in the Gemini app (Alphabet Q1 2026 earnings remarks).
84. Deezer received nearly 90,000 fully AI-generated tracks a day in June 2026 (Deezer, July 2026 AI music update). On peak days, AI tracks made up more than 50% of all new music uploads.
85. More than 2 million AI-generated tracks were uploaded to Deezer per month as of April 2026 (Deezer, April 2026 AI music update). Nearly 75,000 arrived every day, roughly 44% of daily uploads.
86. Over 13.4 million AI-generated tracks were detected and tagged on Deezer in 2025 (Deezer, July 2026 AI music update).
87. Just 1–3% of total streams on Deezer went to fully AI-generated music as of June 2026 (Deezer, July 2026 AI music update).
88. 75% of all new code at Google was AI-generated and approved by engineers in April 2026 (Google Cloud Next 2026). That was up from 50% the previous fall.
89. More than a quarter of all new code at Google was AI-generated in October 2024 (Alphabet Q3 2024 earnings remarks). Engineers then reviewed and accepted it.
On GitHub, a repository is a code project, a pull request is a proposed code change, and an SDK is a developer toolkit.
90. Over 1.13 million public GitHub repositories depended on generative-AI SDKs as of August 2025 (GitHub Octoverse 2025). The count was up 178% year over year.
91. Over 4.3 million AI-related repositories existed on GitHub in 2025 (GitHub Octoverse 2025). The count nearly doubled in under two years.
92. Over 1 million pull requests were created by GitHub Copilot coding agent between May and September 2025 (GitHub Octoverse 2025).
How Much Could Generative AI Add to the Economy?
These are model-based estimates of what generative AI could add, not measured results.
93. Generative AI could add the equivalent of $2.6 trillion to $4.4 trillion annually across 63 use cases, McKinsey estimated in 2023 (McKinsey, Economic potential of generative AI, 2023).
94. Generative AI and other technologies could automate work activities that take up 60 to 70 percent of employees’ time, McKinsey estimated in 2023 (McKinsey, Economic potential of generative AI, 2023).
95. Generative AI could drive a 7% (almost $7 trillion) increase in global GDP over 10 years, Goldman Sachs estimated in 2023 (Goldman Sachs Research, 2023). It could also lift productivity growth by 1.5 percentage points over that period.
96. Generative AI will raise the level of labor productivity by around 15% in the US and developed markets when fully adopted, Goldman Sachs estimates (Goldman Sachs Research, 2025).
97. AI will lift US productivity and GDP by 1.5% by 2035, Penn Wharton Budget Model estimated in 2025 (Penn Wharton Budget Model, 2025). It projects nearly 3% by 2055 and 3.7% by 2075.
How Many Jobs Are Exposed to Generative AI?
Each source below defines exposure in its own way. The last figure tracks job postings instead.
In the ILO’s index, a job counts as “exposed” if it falls into any of four exposure levels, called gradients, from low overall exposure up to the highest exposure.
98. One in four jobs globally (24%) has some degree of GenAI exposure, the ILO’s 2025 refined index finds (ILO, Generative AI and Jobs: A Refined Global Index, 2025).
99. 3.3% of global employment falls into the ILO’s highest GenAI exposure category, per its 2025 index (ILO, Generative AI and Jobs: A Refined Global Index, 2025). The share is 4.7% for female employment versus 2.4% for male employment.
100. 34% of total employment in high-income countries is GenAI-exposed, versus 11% in low-income countries (ILO, 2025) (ILO, Generative AI and Jobs: A Refined Global Index, 2025).
101. 41% of female employment in high-income countries is GenAI-exposed, versus 28% of male employment (ILO, 2025) (ILO, Generative AI and Jobs: A Refined Global Index, 2025).
In the IMF’s analysis, “AI exposure” means how much AI applications overlap with the human abilities an occupation needs.
102. About 40 percent of workers worldwide are in high AI-exposure occupations, the IMF estimated in January 2024 (IMF Staff Discussion Note, Gen-AI and the Future of Work, 2024). The share is 60 percent in advanced economies.
In Penn Wharton’s model, a job is “exposed” if generative AI could automate at least half of its activities.
103. Around 42 percent of current US jobs are potentially exposed to AI, Penn Wharton Budget Model estimated in 2025 (Penn Wharton Budget Model, 2025).
104. Generative AI could expose the equivalent of 300 million full-time jobs to automation, Goldman Sachs estimated in 2023 (Goldman Sachs Research, 2023).
105. Only about 0.3% of US Indeed job postings mentioned GenAI in early 2025, up from 0.1% in January 2024 (Indeed Hiring Lab, 2025).
Generative AI Accuracy, Trust, and Risk
These figures cover how people use and trust AI, how often models get facts wrong, and the risks companies report.
106. 66% of people in 47 countries say they intentionally use AI on a regular basis, a 2024–25 survey found (KPMG & University of Melbourne).
107. 66% of employees in 47 countries report relying on AI output at work without critically evaluating it, a 2024–25 survey found (KPMG & University of Melbourne).
108. 56% of employees in 47 countries say they have made mistakes in their work from AI use, a 2024–25 survey found (KPMG & University of Melbourne).
109. 48% of employees in 47 countries report uploading company information such as financial, sales or customer data into public AI tools, a 2024–25 survey found (KPMG & University of Melbourne).
In the AI Index, an “AI incident” is a case logged in the AI Incident Database where an AI system caused or nearly caused harm.
110. 362 AI incidents were recorded in the AI Incident Database in 2025, up from 233 in 2024 (Stanford HAI, 2026 AI Index Report, ch. 3).
Broadly, a hallucination is false or unsupported content from an AI model. Each source below measures it in its own way.
In the AI Index, “AA-Omniscience” is a 6,000-question factual knowledge test that does not penalize models for refusing to answer.
111. 22% to 94%: hallucination rates across 26 models on the AA-Omniscience benchmark, per the 2026 AI Index (Stanford HAI, 2026 AI Index Report, ch. 3). Grok 4.20 Beta 0305 had the lowest rate; gpt-oss-20B (high) the highest.
In Vectara’s leaderboard, the “hallucination rate” is the share of document summaries that include claims not supported by the source document.
112. 9.3% hallucination rate for OpenAI’s GPT-5.5 when summarizing documents, per Vectara’s leaderboard (Sept 22, 2026) (Vectara Hallucination Leaderboard).
In OpenAI’s system cards, “SimpleQA” is a set of about 4,000 short fact questions, “PersonQA” asks about public facts on people, and the “hallucination rate” counts wrong answers.
113. 33% hallucination rate for OpenAI o3 on the PersonQA benchmark, versus 16% for o1 (2025 system card) (OpenAI o3 and o4-mini System Card). OpenAI says o3 makes more claims overall, both accurate and hallucinated.
114. 40% hallucination rate for gpt-5-thinking on SimpleQA without web access, versus 52% for GPT-4o (2025) (OpenAI GPT-5 System Card).
115. 74% of surveyed business leaders considered inaccuracy a relevant AI risk in 2025, up from 60% in 2024 (Stanford HAI, 2026 AI Index Report, ch. 3). The survey, run with McKinsey, also found 71% actively mitigate inaccuracy risks.
116. 21% of companies report a mature governance model for autonomous AI agents, in a Deloitte survey fielded August–September 2025 (Deloitte State of AI in the Enterprise 2026). Nearly three in four plan to deploy agentic AI within two years.
117. 73% of enterprise leaders name data privacy and security as a top AI risk concern, per Deloitte (2025 survey) (Deloitte State of AI in the Enterprise 2026). Model quality, consistency and explainability concerned 46%.
118. Over 40% of agentic AI projects will be canceled by the end of 2027, Gartner predicts (Gartner, agentic AI projects prediction, June 2025). Gartner cites escalating costs, unclear business value or inadequate risk controls.
119. 95% of organizations are getting zero return from GenAI investment, according to MIT NANDA’s preliminary 2025 report (MIT NANDA, The GenAI Divide (copy hosted by MLQ.ai)). The report counted success as deployment beyond the pilot phase with measurable KPIs.
Conclusion
Usage and investment both grew in the data above. Accuracy and business returns remain the open questions. These figures change quickly. We’ll update this page as new data comes out.