
67 Employee Turnover Statistics for 2026
Employers lose people all the time. Some workers quit for a better offer, some are laid off, and some retire. This page covers how often workers leave, which industries lose staff fastest, what turnover costs and why people quit. Here are the latest employee turnover statistics.
Top Employee Turnover Statistics
- 3.3% was the average monthly job separations rate at US nonfarm employers in 2025 (BLS, JOLTS 2025 annual data).
- 2.0% was the average monthly quits rate at US nonfarm employers in 2025, down from 2.1% in 2024 (BLS, JOLTS 2025 annual data).
- 1.9% was the monthly quits rate for US nonfarm jobs in August 2026, seasonally adjusted (BLS, JOLTS quits rate series).
- 13.0% was the average US voluntary turnover rate in Mercer’s 2025 survey (Mercer, 2025 US Turnover Survey).
- 5.6% was the average monthly job separations rate in US leisure and hospitality in 2025 (BLS, JOLTS 2025 annual data).
- 33% of base wages is Work Institute’s estimated cost to replace an employee, in its 2025 report (Work Institute, 2025 Retention Report).
- 19.2% of departing employees in Work Institute’s 2025 exit interviews cited career reasons, the top reason (Work Institute, 2026 Retention Report).
- 52% of US employees were watching for or actively seeking a new job as of May 2026 (Gallup, Employee Retention & Attraction indicator).
What Is the Average Job Turnover Rate?
These figures come from the US Bureau of Labor Statistics (BLS). Its Job Openings and Labor Turnover Survey (JOLTS) reports turnover per month and leaves out farm jobs, so its figures say “nonfarm.” Seasonally adjusted figures remove the normal ups and downs of the calendar.
In BLS JOLTS data, “total separations” counts exits from a payroll during the month: quits, layoffs and discharges, and other separations (BLS, JOLTS Technical Note).
In BLS JOLTS data, an “annual average rate” is a year’s 12 monthly counts added together, such as quits, divided by total employment over the same 12 months, times 100 (BLS, JOLTS Technical Note).
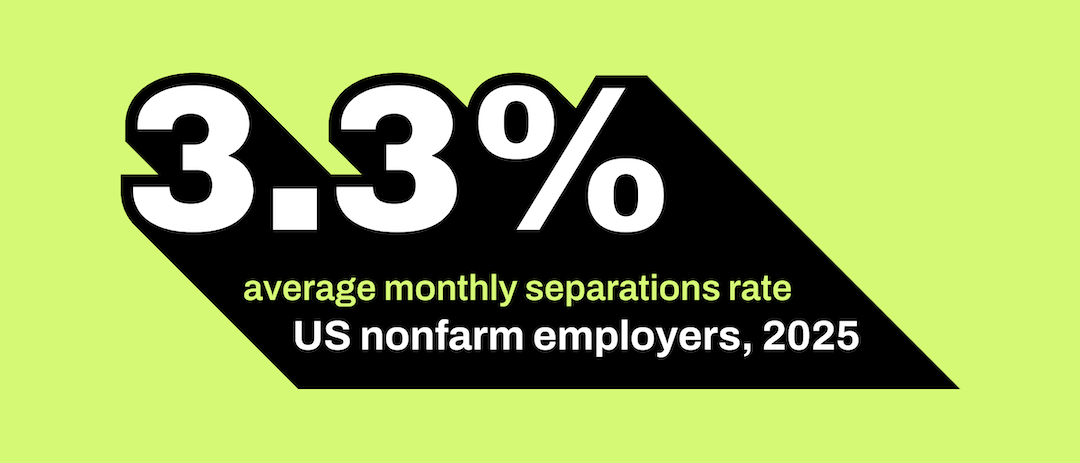
1. 3.3% was the average monthly job separations rate at US nonfarm employers in 2025 (BLS, JOLTS 2025 annual data). The rate was unchanged from 2024 and is not seasonally adjusted.
3.3% average monthly job separations rate at US nonfarm employers in 2025
Source: BLS, JOLTS 2025 annual data, annual average, not seasonally adjusted.
2. 62.8 million job separations were recorded at US nonfarm employers in 2025 (BLS, JOLTS 2025 annual data).
3. 3.2% was the monthly job separations rate for US nonfarm jobs in August 2026, seasonally adjusted (BLS, JOLTS separations rate series). The August figure is preliminary.
How Often Do US Workers Quit or Get Laid Off?
These BLS figures split job exits into quits and layoffs.
In BLS JOLTS data, “quits” are employees who left voluntarily, not counting retirements or transfers to other locations (BLS, JOLTS Technical Note).
4. 2.0% was the average monthly quits rate at US nonfarm employers in 2025, down from 2.1% in 2024 (BLS, JOLTS 2025 annual data).
5. 38.0 million quits made up 60.6% of US nonfarm job separations in 2025 (BLS, JOLTS 2025 annual data). Quits fell by 1.3 million from 2024.
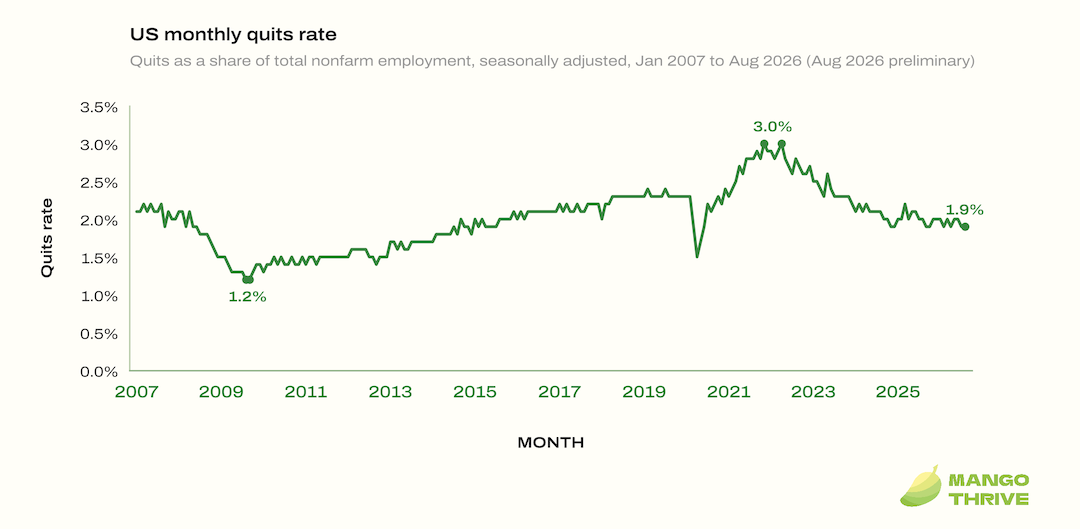
6. 1.9% was the monthly quits rate for US nonfarm jobs in August 2026, seasonally adjusted (BLS, JOLTS quits rate series). The August figure is preliminary.
7. 3.0% was the monthly quits rate for US nonfarm jobs in November 2021 and April 2022, seasonally adjusted (BLS, JOLTS quits rate series).
8. 1.2% was the monthly quits rate for US nonfarm jobs in August and September 2009, seasonally adjusted (BLS, JOLTS quits rate series).
US monthly quits rate, seasonally adjusted, January 2007 to August 2026
Source: BLS, JOLTS quits rate series, seasonally adjusted; August 2026 is preliminary.
In BLS JOLTS data, “layoffs and discharges” are involuntary exits started by the employer, including firings for cause (BLS, JOLTS Technical Note).
9. 1.1% was the average monthly layoffs and discharges rate at US nonfarm employers in 2025 (BLS, JOLTS 2025 annual data).
10. 21.2 million layoffs and discharges made up 33.8% of US nonfarm job separations in 2025 (BLS, JOLTS 2025 annual data). That was 1.2 million more than in 2024.
Other Estimates of Employee Turnover
These estimates come from Mercer’s turnover survey, ADP Research and a Mercer poll of employers. Mercer and ADP each define turnover in their own way.
In Mercer’s survey, “voluntary turnover” leaves out retirees, volunteers and contractors (Mercer, 2025 US Turnover Survey).
11. 13.0% was the average US voluntary turnover rate in Mercer’s 2025 survey (Mercer, 2025 US Turnover Survey). The survey covered 2,617 US organizations, with data from 2024 to 2025.
12. 17.3% was the average US voluntary turnover rate in Mercer’s 2023 survey, versus 13.5% in its 2024 survey (Mercer, 2025 US Turnover Survey).
In ADP Research data, “turnover” is the number of people who left an employer in a month, divided by its active employees the month before (ADP Research).
13. About 4.7% was the monthly turnover rate at US private employers over the last three years, according to ADP Research (ADP Research, April 2026). That is nearly one person leaving for every 20 employees.
14. 3.9% monthly turnover at US employers with fewer than 50 workers in March 2026 was the lowest in nine years of ADP data (ADP Research, April 2026).
15. 40% of US employers said in June 2026 that turnover was about the same as before the pandemic (Mercer, June 2026 QuickPulse). Only 4% reported significantly higher turnover, among 330 organizations surveyed.
Which Industries Have the Highest Turnover?
These figures compare turnover across industries and job levels. Mercer reports a yearly rate from the employers it surveys. BLS reports an average monthly rate for all US nonfarm employers. Use the table to look up your own industry.
16. 26.7% turnover in retail and wholesale was the highest of any US industry in Mercer’s 2025 survey (Mercer, 2025 US Turnover Survey). Insurance and reinsurance had the lowest rate, at 8.2%.
17. 5.6% was the average monthly job separations rate in US leisure and hospitality in 2025 (BLS, JOLTS 2025 annual data).
| Industry | Average monthly separations rate, 2024 (%) | Average monthly separations rate, 2025 (%) |
|---|---|---|
| Total private | 3.7 | 3.6 |
| Mining and logging | 3.3 | 3.3 |
| Construction | 4.0 | 4.0 |
| Manufacturing | 2.7 | 2.4 |
| – Durable goods | 2.5 | 2.3 |
| – Nondurable goods | 3.1 | 2.7 |
| Trade, transportation, and utilities | 3.6 | 3.5 |
| – Wholesale trade | 2.4 | 2.3 |
| – Retail trade | 4.0 | 3.8 |
| – Transportation, warehousing, and utilities | 3.9 | 4.0 |
| Information | 2.8 | 2.8 |
| Financial activities | 2.2 | 2.3 |
| – Finance and insurance | 1.9 | 2.1 |
| – Real estate and rental and leasing | 2.9 | 2.6 |
| Professional and business services | 4.4 | 4.6 |
| Private education and health services | 2.9 | 2.8 |
| – Private educational services | 2.2 | 2.2 |
| – Health care and social assistance | 3.0 | 2.9 |
| Leisure and hospitality | 5.5 | 5.6 |
| – Arts, entertainment, and recreation | 6.1 | 6.1 |
| – Accommodation and food services | 5.4 | 5.5 |
| Other services | 3.6 | 3.3 |
| Government | 1.4 | 1.5 |
| – Federal | 1.1 | 1.8 |
| – State and local | 1.5 | 1.4 |
| – – State and local education | 1.4 | 1.4 |
| – – State and local, excluding education | 1.5 | 1.5 |
Source: BLS, JOLTS 2025 annual data, Table 20, not seasonally adjusted. A dash marks part of the closest row above it with fewer dashes.
18. 4.2% was the average monthly quits rate in US accommodation and food services in 2025 (BLS, JOLTS 2025 annual data).
19. 2.6% was the average monthly quits rate in US retail trade in 2025 (BLS, JOLTS 2025 annual data).
20. 0.8% was the average monthly quits rate in US state and local government education in 2025 (BLS, JOLTS 2025 annual data).
21. 5.2% was the turnover rate for heads of organizations and executives in Mercer’s 2025 US survey (Mercer, 2025 US Turnover Survey). Para-professional blue-collar staff had a rate of 12.5%.
Turnover at Hospitals and Trucking Companies
These figures come from industry surveys of hospitals and trucking companies.
In NSI’s hospital survey, “turnover” is the number of separations divided by the average number of employees, times 100 (NSI, 2026 Health Care Retention Report).
22. 18.5% was the national turnover rate at US acute care hospitals in 2025 (NSI, 2026 Health Care Retention Report). NSI surveyed 527 hospitals in 40 states, excluding temporary, agency and travel staff.
23. 17.6% was the average turnover rate for staff registered nurses at US acute care hospitals in 2025 (NSI, 2026 Health Care Retention Report).
24. 94.9% of separations at US acute care hospitals in 2025 were voluntary (NSI, 2026 Health Care Retention Report).
25. 44.2% was the average truck driver turnover rate at for-hire trucking carriers in 2025, down from 48.0% in 2024 (ATRI, Operational Costs of Trucking 2026). The data cover for-hire carriers in the US and Canada.
How Much Does Employee Turnover Cost?
These figures estimate what it costs employers to replace workers who leave.
In Work Institute’s 2024 report, the “cost of turnover” includes direct costs, such as recruiters and initial training, and indirect costs, such as lost productivity and manager interview time (Work Institute, 2024 Retention Report).
26. 33% of base wages is Work Institute’s estimated cost to replace an employee, in its 2025 report (Work Institute, 2025 Retention Report).
27. Replacing an employee who earns $50,000 a year costs at least $16,500, Work Institute estimates (Work Institute, 2025 Retention Report).
28. Nearly $900 billion was spent by US companies replacing employees who quit in 2023, Work Institute estimates (Work Institute, 2024 Retention Report).
29. Only 11% of employers strongly agree they consistently track turnover costs, Work Institute found (Work Institute, 2025 Retention Report). The survey covered 88 HR and operational leaders.
30. One-half to two times an employee’s annual salary is what replacing them can cost, Gallup estimated in 2019 (Gallup, 2019).
31. $5,475 was the average cost to fill a nonexecutive job in SHRM’s 2025 benchmarking survey (SHRM, 2025 Benchmarking). For executive hires, the average was $35,879.
32. 21% of annual salary was the typical cost of turnover in a 2012 Center for American Progress review (CAP, 2012). It is the median of 27 case studies, leaving out executives and physicians.
What Are the Top Reasons Employees Leave?
These figures come from exit interviews, which are interviews with employees who are leaving or have recently left a job, and from surveys of people who quit.
33. 19.2% of departing employees in Work Institute’s 2025 exit interviews cited career reasons, the top reason (Work Institute, 2026 Retention Report). Career reasons include a lack of growth or advancement. Work-life balance ranked second, at 12.4%.
34. 9.2% of departing employees in Work Institute’s 2025 exit interviews cited management, the fourth most cited reason (Work Institute, 2026 Retention Report). Total Rewards, which Work Institute defines as dissatisfaction with pay, benefits or perceived inequity compared to market standards, accounted for 7.7%.
In Work Institute’s data, “preventable” reasons are career, health and family, work-life balance, management, total rewards, job and environment (Work Institute, 2026 Retention Report).
35. 74.69% of reasons for leaving in 2025 fell into categories Work Institute classifies as preventable (Work Institute, 2026 Retention Report). The data come from 15,424 exit interviews, about 60% in healthcare organizations.
36. 19.6% of separations in Q2 2026 were career-related, the leading reason for leaving (Work Institute, Q2 2026). The report analyzed 3,265 exit interviews.
37. 42% of US workers who quit said their manager or employer could have prevented it, in a 2023 Gallup survey (Gallup, 2024). Gallup surveyed 717 employees who had voluntarily left an employer in the past year.
38. 45% of US workers who quit said no manager or leader proactively discussed their satisfaction or future in their last three months, per Gallup in 2023 (Gallup, 2024).
39. 77% of US workers who quit left within three months of starting a job search or never actively searched, per Gallup in 2023 (Gallup, 2024).
40. 63% of US workers who quit a job in 2021 named low pay as a reason (Pew Research Center, 2022). The same share named no chance for advancement, and 57% felt disrespected at work.
How Many Employees Are Looking for a New Job?
These Gallup and PwC surveys ask workers whether they are looking for a new job or how likely they are to change employers.
In Gallup’s surveys, “watching for or actively seeking a new job” combines employees actively looking with those watching for openings (Gallup, State of the Global Workplace 2025).
41. 52% of US employees were watching for or actively seeking a new job as of May 2026 (Gallup, Employee Retention & Attraction indicator).
42. More than three in five Gen Z workers in the US were seeking or watching for a new job in Q4 2025 (Gallup, March 2026). Among Gen Z, 17% were actively seeking, versus just 4% of baby boomers.
43. 56% of US workers looking or watching for a new job in Q4 2025 hoped to find something better or different (Gallup, March 2026). 44% said they were looking because they were dissatisfied with some elements of their current job.
44. 69% of US workers looking for something better cited pay or benefits, the top reason, in Q4 2025 (Gallup, March 2026). So did 53% of dissatisfied workers who were looking.
45. 50% of employees worldwide were watching for or actively seeking a new job in 2025 (Gallup, Employee Retention & Attraction indicator).
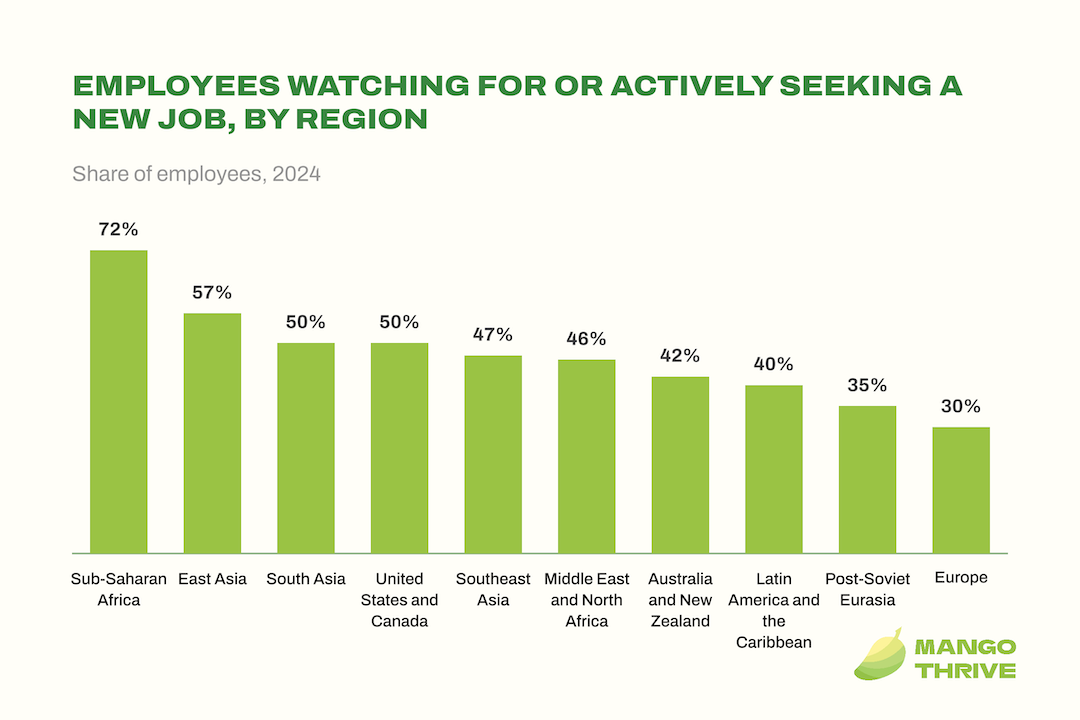
46. 72% of employees in Sub-Saharan Africa were watching for or seeking a new job in 2024, the highest of 10 regions (Gallup, State of the Global Workplace 2025). Europe ranked last, at 30%.
Share of employees watching for or actively seeking a new job in 10 world regions, 2024
Source: Gallup, State of the Global Workplace 2025, p. 23.
47. 58% of employees under 35 worldwide were watching for or seeking a new job in 2024 (Gallup, State of the Global Workplace 2025). Among those 35 and older, it was 43%.
48. 29% of PwC’s “front-runner” workers, those with strong AI capabilities and scarce skills, say they are very or extremely likely to change employer in the next year (PwC, Hopes and Fears 2026). PwC surveyed 49,364 workers in 48 countries and regions in May and June 2026.
How Long Do Employees Stay With One Employer?
These figures show how long people stay with one employer and how many jobs they hold over a career.
In BLS data, “employee tenure” is how long wage and salary workers had been with their current employer when surveyed; it excludes the self-employed (BLS, Employee Tenure Technical Note).
49. 4.1 years was the median time US wage and salary workers had been with their current employer in January 2026 (BLS, Employee Tenure in 2026). It was up from 3.9 years in January 2024.
50. 4.3 years was the median tenure of male US wage and salary workers in January 2026, versus 4.0 years for women (BLS, Employee Tenure in 2026).
51. 9.6 years was the median tenure of US wage and salary workers ages 55 to 64 in January 2026 (BLS, Employee Tenure in 2026). For workers ages 25 to 34, it was 3.0 years.
52. 20.6% of US wage and salary workers had been with their employer a year or less in January 2026 (BLS, Employee Tenure in 2026). The share was 22.2% in January 2024.
53. 74.1% of US wage and salary workers ages 16 to 19 had 12 months or less with their employer in January 2026 (BLS, Employee Tenure in 2026). Among workers ages 55 to 64, it was 9.2%.
54. 3.9 years was the median tenure of US private-sector wage and salary workers in January 2026 (BLS, Employee Tenure in 2026). In the public sector, it was 5.6 years.
55. 2.4 years was the median tenure in US leisure and hospitality in January 2026, the lowest of any major private-sector industry (BLS, Employee Tenure in 2026).
In BLS’s NLSY79 study, a “job” is an uninterrupted period of work with one employer, not a position (BLS, NLSY79 Technical Note).
56. 12.9 was the average number of jobs held from ages 18 to 58 by US residents born from 1957 to 1964, BLS reported in 2025 (BLS, NLSY79).
57. 2.7 is the average number of companies Gen Z workers have worked for in 2.8 years of employment after age 21 (Revelio Labs, April 2025). Baby boomers averaged 3.6 companies over 27.1 years, a figure Revelio says may be understated because online profiles can leave out early-career jobs.
How Much Turnover Happens in the First Year?
These figures show how much turnover happens soon after people start a job.
58. As much as 40% of employee turnover happens in the first year of employment, per Work Institute’s 2025 report (Work Institute, 2025 Retention Report).
59. 27.0% of separations in Q2 2026 involved employees with less than one year of service, Work Institute found (Work Institute, Q2 2026).
60. 29.5% of new hires at US acute care hospitals left within a year, in NSI data covering 2025 (NSI, 2026 Health Care Retention Report). These first-year leavers made up 35.6% of all turnover.
Employee Turnover Outside the US
These figures come from national statistics agencies and a UK employer survey. Each country measures job changes in its own way.
In ABS data, the “job mobility rate” is the share of people employed in February who changed employer or business in the previous 12 months (ABS).
61. 7.2% of employed Australians changed employer or business in the year to February 2026 (ABS, Job Mobility). That was down from 7.7% a year earlier.
62. 12.0% of employed Australians aged 15 to 24 changed employer or business in the year to February 2026 (ABS, Job Mobility).
In Japan’s Survey on Employment Trends, the “separation rate” is people who left during the year as a share of employees at the start of the year, including part-time workers (MHLW).
63. 13.7% was Japan’s separation rate in 2025, down from 14.2% in 2024 (MHLW, Survey on Employment Trends 2025). The survey covers establishments with five or more employees.
64. 19.9% was the separation rate for part-time workers in Japan in 2025 (MHLW, Survey on Employment Trends 2025).
65. 10.2% of Japan’s employees left for personal reasons in 2025, and 0.9% for employer-side reasons (MHLW, Survey on Employment Trends 2025, reasons for leaving). Employers, not workers, reported the reasons.
66. 4.1% was the median labour turnover rate reported by UK employers for 2025 (CIPD, Resourcing and Talent Planning 2026). Only 310 organisations gave full figures, many of them very small.
In Statistics Canada data, “job tenure” is the number of consecutive months or years a person has worked for their current or most recent employer (Statistics Canada).
67. 100.3 months, or about 8.4 years, was the average job tenure of employed Canadians in 2025 (Statistics Canada, Table 14-10-0051-01). The figure excludes the territories.
Conclusion
Americans quit their jobs less often now than a few years ago. Some industries still lose staff much faster than others. Many people who leave say their employer could have kept them. We’ll update this page as new data comes out.