
105 Consumer Spending Statistics for 2026
Rent, groceries, a new car and a streaming plan all count as consumer spending. Economists track it closely, and households feel it in their monthly budgets. This page covers how much people spend, what they spend it on and how they pay. It also compares spending by income, age, state and country. Here are the latest consumer spending statistics.
Top Consumer Spending Statistics
-
$20.87 trillion is what US consumers spent on goods and services in 2025.
-
$78,535 was the average annual spending of US consumer units in 2024, up from $77,158 in 2023.
-
0.9% was the rise in US consumer spending in August 2026, an increase of $190.8 billion.
-
67.6% of US GDP in 2025 came from consumer spending.
-
57% of US consumer spending came from the top 20% of earners on average from 2020 to mid-2025.
-
34% of payments by US consumers went on credit cards in October 2025, counted by number of payments.
Atlanta Fed, 2025 Survey and Diary of Consumer Payment Choice
-
$63.2 trillion is what households worldwide spent on goods and services in 2024, according to World Bank estimates.
How Much Do Consumers Spend?
These figures from the Bureau of Economic Analysis (BEA) and the Bureau of Labor Statistics (BLS) show total US consumer spending, spending per person and spending per household.
In BEA’s data, “personal consumption expenditures” means the value of goods and services bought by or for US residents.
1. $20.87 trillion is what US consumers spent on goods and services in 2025 (BEA, NIPA Table 2.3.5).
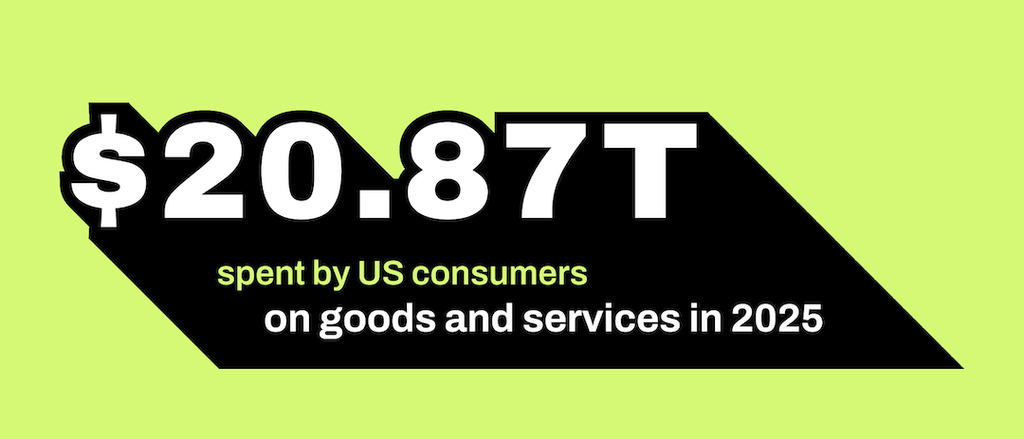
Source: BEA, NIPA Table 2.3.5.
2. US consumer spending averaged $61,034 per person in 2025 (BEA, NIPA Table 7.1).
In BLS’s data, a “consumer unit” means a family, a financially independent single person, or people living together who share major expenses.
3. $78,535 was the average annual spending of US consumer units in 2024, up from $77,158 in 2023 (BLS, Consumer Expenditures—2024).
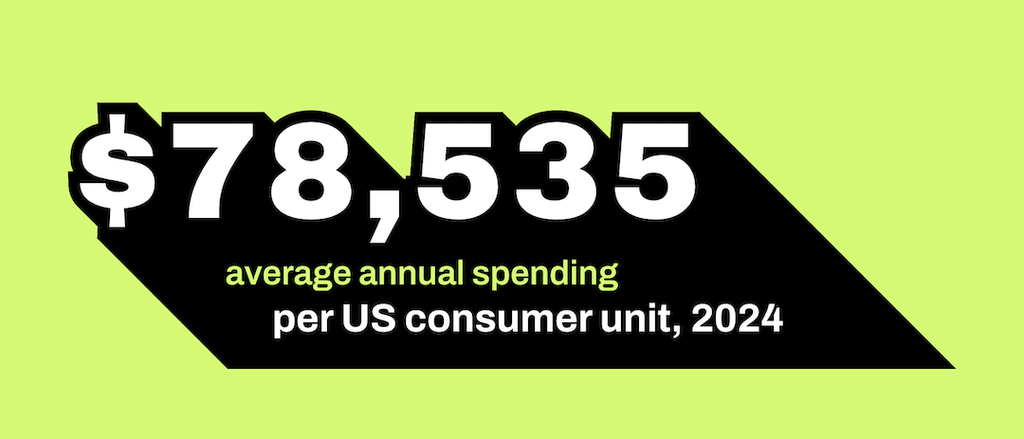
Source: BLS, Consumer Expenditures—2024.
Is US Consumer Spending Up or Down?
These figures show the latest monthly, quarterly and yearly changes in US consumer spending. Real figures remove the effect of price changes. Q1 and Q2 mean the first and second quarters of the year.
4. 0.9% was the rise in US consumer spending in August 2026, an increase of $190.8 billion (BEA, Personal Income and Outlays, August 2026). The change is from July, in current dollars.
5. US consumer spending rose 0.9% in August 2026, matching March 2026 for the biggest monthly rise since December 2024 (BEA, Personal Income and Outlays, August 2026 historical comparisons).
6. $114.1 billion of August 2026’s spending increase went to goods; $76.7 billion went to services (BEA, Personal Income and Outlays, August 2026).
7. After adjusting for prices, US consumer spending grew 0.6% in August 2026 (BEA, Personal Income and Outlays, August 2026).
In BEA’s data, an “annual rate” shows what a quarter’s change would be if it lasted a full year.
8. Real US consumer spending grew at a 3.8% annual rate in Q2 2026 (BEA, NIPA Table 1.1.1). Q1 2026 growth was 0.7%, also at an annual rate.
9. Real US consumer spending grew 2.6% in 2025, down from 2.9% in 2024 (BEA, NIPA Table 1.1.1).
How Much of the US Economy Is Consumer Spending?
These figures show consumer spending as a share of US gross domestic product (GDP) and its part in GDP growth.
10. 67.6% of US GDP in 2025 came from consumer spending (BEA, NIPA Table 1.1.10).
11. Consumer spending added 2.51 percentage points to real US GDP growth of 2.2% in Q2 2026 (BEA, NIPA Table 1.1.2). Both figures are at annual rates.
What Do Americans Spend Their Money On?
These figures break down total US consumer spending by type of product.
12. $3.81 trillion of US consumer spending went to housing and utilities in 2025 (BEA, NIPA Table 2.3.5).
| Category | 2025 |
|---|---|
| Housing and utilities | 3.81 |
| Health care | 3.57 |
| Other services | 1.73 |
| Other nondurable goods | 1.72 |
| Financial services and insurance | 1.65 |
| Food and beverages for off-premises consumption | 1.52 |
| Food services and accommodations | 1.50 |
| Recreation services | 0.80 |
| Motor vehicles and parts | 0.77 |
| Transportation services | 0.70 |
| Recreational goods and vehicles | 0.69 |
| Clothing and footwear | 0.56 |
| Furnishings and durable household equipment | 0.50 |
| Gasoline and other energy goods | 0.42 |
| Other durable goods | 0.30 |
13. $3.57 trillion of US consumer spending went to health care in 2025 (BEA, NIPA Table 2.3.5).
14. $14.38 trillion of US consumer spending went to services in 2025, versus $6.49 trillion for goods (BEA, NIPA Table 2.3.5).
15. $1.52 trillion of US consumer spending went to food and drinks bought for off-premises consumption in 2025 (BEA, NIPA Table 2.3.5). Another $1.50 trillion went to food services and accommodations.
How Do US Households Divide Their Budget?
Most of these figures come from the BLS survey of household spending.
16. 33.4% of spending by US consumer units went to housing in 2024, an average of $26,266 per consumer unit (BLS, Consumer Expenditures—2024).
17. 17.0% of spending by US consumer units went to transportation in 2024, an average of $13,318 per consumer unit (BLS, Consumer Expenditures—2024).
18. $10,169 went to food per US consumer unit in 2024, 12.9% of total spending (BLS, Consumer Expenditures—2024).
19. $6,197 went to healthcare per US consumer unit in 2024, 7.9% of total spending (BLS, Consumer Expenditures—2024).
20. 12.5% of spending by US consumer units went to personal insurance and pensions in 2024, an average of $9,797 per consumer unit (BLS, Consumer Expenditures—2024). Social Security deductions made up $6,684 of it.
21. 83.7% of spending by US consumer units in 2024 went to five categories: housing, transportation, food, healthcare, and personal insurance and pensions (BLS, Consumer Expenditures in 2024).
The Consumer Price Index (CPI) tracks the prices of goods and services that people buy.
In BLS’s data, “relative importance” means an item’s share of consumer spending used to weight the Consumer Price Index.
22. 35.6% of the US CPI basket’s weight went to shelter in December 2025 (BLS, CPI Relative Importance, December 2025). The weights come from what urban US consumers spent on each item.
How Did Household Spending Change in 2024?
These figures show how US household spending changed in the latest BLS survey year.
23. 1.8% was the rise in average US household spending in 2024, below 2.9% inflation (BLS, Consumer Expenditures in 2024). BLS puts real spending growth at −1.1%.
A statistically significant change is one that is unlikely to be due to chance in the survey sample.
24. 3.3% was the 2024 rise in average housing spending by US consumer units, the only statistically significant increase among major categories (BLS, Consumer Expenditures—2024).
25. 12.3% was the jump in average US vehicle insurance spending in 2024, to $1,993 (BLS, Consumer Expenditures in 2024). It rose 11.5% in 2023.
26. 21.5% was the 2024 rise in spending on meat, poultry, fish, and eggs per US consumer unit (BLS, Consumer Expenditures in 2024). Beef spending rose 32.0% while beef prices rose 5.4%.
How Does Spending Differ by Income?
These figures compare spending by people at different income levels.
27. $150,342 was the 2024 average spending of the top fifth of US consumer units by income (BLS, Consumer Expenditures—2024). The bottom fifth spent $35,046.
28. $179,513 was the average 2024 spending of the top 10% of US consumer units by income (BLS, Consumer Expenditure Surveys, 2024 demographic tables). The bottom 10% spent $31,660 on average.
| Income group | 2024 |
|---|---|
| Lowest 10% | 31660 |
| Second 10% | 38473 |
| Third 10% | 46340 |
| Fourth 10% | 53778 |
| Fifth 10% | 62880 |
| Sixth 10% | 70913 |
| Seventh 10% | 81716 |
| Eighth 10% | 98158 |
| Ninth 10% | 121317 |
| Highest 10% | 179513 |
29. 3.8% was the 2024 spending rise for the lowest-income fifth of US consumer units, versus 0.4% for the top fifth (BLS, Consumer Expenditures in 2024).
30. 5.5% was the yearly card spending growth for lower-income Bank of America households in September 2026 (Bank of America Institute, Consumer Checkpoint, October 2026). Spending grew 4.9% for middle-income households, 4.8% for higher-income ones and 5.9% for the top 5% by income.
31. 33.0% of before-tax income went to food for the lowest-income fifth of US households in 2024 (USDA ERS, Food Prices and Spending). The top fifth spent 6.4% of before-tax income on food.
What Share of Spending Comes From the Top 10% of Earners?
Estimates of this share vary by source and method.
32. 45.8% of US consumer spending in 2025 came from the top 10% of earners, Moody’s Analytics estimates (Bloomberg Opinion via Financial Advisor, April 2026). The widely shared “nearly 50%” figure came from Moody’s older method, which ignored taxes.
33. 22.9% of total spending in the BLS Consumer Expenditure Survey came from the top 10% of US consumer units by pre-tax income in 2024 (BLS, Consumer Expenditure Survey series CXUTOTALEXPLB1511M). The share was 23.5% in 2014.
What Share of Spending Comes From the Top 20% of Earners?
These estimates come from the Dallas Fed and Moody’s Analytics.
34. 57% of US consumer spending came from the top 20% of earners on average from 2020 to mid-2025 (Dallas Fed, November 2025). The Dallas Fed estimate counts taxes, and it puts this share at 53% in the 1990s.
In BEA’s data, “personal outlays” means consumer spending plus interest payments and transfer payments.
35. Nearly 60% of US personal outlays came from the top 20% of earners in Q1 2026 (Mark Zandi, Moody’s Analytics, LinkedIn, June 2026). Moody’s defines this group as people earning over $175,000 a year, and Zandi wrote that the estimates may overstate the case.
How Much Do Renters and Homeowners Spend?
These figures compare renters and homeowners.
36. US renters spent an average of $57,108 per consumer unit in 2024 (BLS, Consumer Expenditure Surveys, 2024 demographic tables). Homeowners with a mortgage spent $104,329.
How Does Spending Differ by Age?
These figures show average yearly spending by the age and birth year of the person who heads each household.
In BLS’s data, the “reference person” is the person who owns or rents the home, named first by the respondent.
Below, “headed by” refers to this reference person.
37. $100,327 was the average 2024 spending of US consumer units headed by someone aged 45 to 54 (BLS, Consumer Expenditure Surveys, 2024 demographic tables). Units headed by someone under 25 spent $47,283.
| Age group | 2024 |
|---|---|
| Under 25 | 47283 |
| 25 to 34 | 74475 |
| 35 to 44 | 91229 |
| 45 to 54 | 100327 |
| 55 to 64 | 84946 |
| 65 and older | 61432 |
38. $55,834 was the average 2024 spending of US consumer units headed by someone 75 or older (BLS, Consumer Expenditure Surveys, 2024 demographic tables). Units headed by someone aged 65 to 74 spent $65,354.
39. $96,941 was the average 2024 spending of US consumer units headed by someone born 1965 to 1980 (BLS, Consumer Expenditure Surveys, 2024 demographic tables). Units headed by someone born 1981 to 1996 spent $85,302.
40. $54,830 was the average 2024 spending of US consumer units headed by someone born in 1997 or later (BLS, Consumer Expenditure Surveys, 2024 demographic tables). Units headed by someone born 1946 to 1964 spent $69,303.
How Much Do Consumers Spend in Each State?
These figures cover consumer spending in each US state and Washington, D.C.
41. US consumer spending rose 5.3% in 2025 before adjusting for prices, and it grew in all 50 states and D.C. (BEA, GDP Third Estimate, Q2 2026; State PCE, 2025). Spending rose in 14 of 16 major categories.
42. Florida’s consumer spending grew 7.0% in 2025, the most of any state; California’s grew 4.2%, the least (BEA, GDP Third Estimate, Q2 2026; State PCE, 2025). Health care and housing and utilities drove growth in most states.
43. $74,900 was per-person consumer spending in Massachusetts in 2025, versus $45,855 in Mississippi (BEA, Table SAPCE2). The US figure in this state table was $61,062.
| State | Consumer spending per person, 2025 ($) |
|---|---|
| United States (whole country) | 61,062 |
| Alabama | 48,725 |
| Alaska | 70,227 |
| Arizona | 58,361 |
| Arkansas | 48,180 |
| California | 70,076 |
| Colorado | 68,438 |
| Connecticut | 70,377 |
| Delaware | 63,664 |
| District of Columbia | 98,784 |
| Florida | 66,061 |
| Georgia | 55,158 |
| Hawaii | 63,695 |
| Idaho | 49,627 |
| Illinois | 63,730 |
| Indiana | 54,273 |
| Iowa | 51,254 |
| Kansas | 53,553 |
| Kentucky | 51,641 |
| Louisiana | 52,584 |
| Maine | 65,444 |
| Maryland | 60,794 |
| Massachusetts | 74,900 |
| Michigan | 57,346 |
| Minnesota | 61,104 |
| Mississippi | 45,855 |
| Missouri | 57,032 |
| Montana | 61,349 |
| Nebraska | 56,840 |
| Nevada | 58,443 |
| New Hampshire | 72,282 |
| New Jersey | 68,561 |
| New Mexico | 50,932 |
| New York | 69,658 |
| North Carolina | 55,700 |
| North Dakota | 61,192 |
| Ohio | 55,295 |
| Oklahoma | 47,797 |
| Oregon | 60,667 |
| Pennsylvania | 62,438 |
| Rhode Island | 60,999 |
| South Carolina | 53,665 |
| South Dakota | 56,774 |
| Tennessee | 53,530 |
| Texas | 55,875 |
| Utah | 54,512 |
| Vermont | 65,694 |
| Virginia | 60,615 |
| Washington | 65,667 |
| West Virginia | 52,770 |
| Wisconsin | 57,246 |
| Wyoming | 62,488 |
Source: BEA, Table SAPCE2. Current dollars.
How Much Do Americans Spend at Stores and Online?
These Census Bureau figures cover sales at stores, online sellers and restaurants.
In Census data, “retail and food services sales” means sales by retailers, including nonstore retailers, and by food services and drinking places, counting only businesses with paid employees.
44. $8.35 trillion was the total of US retail and food services sales in 2025 (Census Bureau, Monthly Retail Trade Survey, 1992–present). The total is not adjusted for price changes.
45. $7.32 trillion went through US retailers in 2025, excluding food services and drinking places (Census Bureau, Monthly Retail Trade Survey, 1992–present).
In Census data, “e-commerce sales” are sales ordered or agreed online; payment may happen offline.
46. $340.2 billion was US retail e-commerce sales in Q2 2026, seasonally adjusted (Census Bureau, Quarterly Retail E-Commerce Sales, Q2 2026). The estimate is preliminary.
47. 12.2% was the year-over-year growth in US retail e-commerce sales in Q2 2026 (Census Bureau, Quarterly Retail E-Commerce Sales, Q2 2026). Total retail sales grew 6.7% over the same period. Both estimates are preliminary.
48. 17.1% of US retail sales happened through e-commerce in Q2 2026, seasonally adjusted (Census Bureau, Quarterly Retail E-Commerce Sales, Q2 2026). The estimate is preliminary.
How Much Do Americans Spend on Food?
These figures cover food spending at home and away from home.
49. 9.7% of US consumers’ disposable income went to food in 2025, down from 10.4% in 1997 (USDA ERS, Food Prices and Spending).
In USDA ERS data, “food away from home” means prepared meals and snacks bought to eat right away.
50. 4.9% of US disposable income went to food away from home in 2025, versus 4.8% for food at home (USDA ERS, Food Prices and Spending).
51. 50.42% of US household food spending went to food away from home in 2025 (USDA ERS, Food Expenditure Series).
52. $2.51 trillion was total US food spending by consumers, businesses, and government in 2025 (USDA ERS, Food Prices and Spending). Food away from home took $1.41 trillion.
53. $1.03 trillion went to US restaurants, bars and other food services in 2025 (Census Bureau, Monthly Retail Trade Survey, 1992–present). Census counts these under “food services and drinking places.”
54. $1.55 trillion in US restaurant and foodservice sales is the 2026 forecast from the National Restaurant Association (National Restaurant Association, 2026 State of the Restaurant Industry release).
Travel and Streaming Spending Statistics
These figures cover travel spending, vacation plans and streaming subscriptions.
55. The U.S. Travel Association forecasts $1.37 trillion in US travel spending for 2026 (U.S. Travel Association, U.S. Travel Forecast, Spring 2026). The total includes business travel and international visitors, in 2025 inflation-adjusted dollars.
56. 42.6% of US consumers planned a vacation in the next six months, as of September 2026 (The Conference Board, Consumer Confidence Survey, September 2026). The figure is preliminary.
57. $69 a month is what the average US household with paid streaming video spends on those services (Deloitte, Digital Media Trends 2026 dashboard). Millennials reportedly spend the most, at $76 a month.
58. 41% of US consumers canceled a paid streaming video service in the past six months, Deloitte found in 2026 (Deloitte, Digital Media Trends 2026 dashboard). Among millennials, 52% did.
59. About 40% of US consumers say they recently cut back on entertainment subscriptions because of money worries (Deloitte, Digital Media Trends 2026 dashboard). Almost 75% say they’re frustrated by price increases.
How Much Will Americans Spend This Holiday Season?
These are forecasts for this year’s holiday shopping season.
60. $1.70 trillion to $1.71 trillion in US holiday retail sales, excluding autos and gasoline, is Deloitte’s forecast for November 2026 to January 2027 (Deloitte, 2026 holiday retail forecast). That would be 4.0% to 4.8% more than a year earlier.
61. $275.1 billion in US online holiday sales is Adobe’s forecast for Nov. 1 to Dec. 31, 2026 (Adobe, 2026 holiday forecast release). That would be up 6.7% from 2025.
How Do Americans Pay for Purchases?
These figures cover payment methods, card spending and buy now, pay later.
In the Atlanta Fed’s data, “payments” include transfers and taxes, so they are not the same as spending.
62. 34% of payments by US consumers went on credit cards in October 2025, counted by number of payments (Atlanta Fed, 2025 Survey and Diary of Consumer Payment Choice). Debit cards made up 31% and cash 14%.
| Year | Credit or charge cards | Debit cards | Cash |
|---|---|---|---|
| 2015 | 18.26 | 29.49 | 33.27 |
| 2016 | 18.18 | 27.09 | 30.82 |
| 2017 | 21.36 | 26.49 | 30.26 |
| 2018 | 23.14 | 28.07 | 25.86 |
| 2019 | 23.87 | 30.51 | 25.80 |
| 2020 | 26.92 | 28.15 | 18.59 |
| 2021 | 28.34 | 29.27 | 19.41 |
| 2022 | 31.27 | 29.16 | 17.43 |
| 2023 | 32.44 | 29.76 | 16.00 |
| 2024 | 34.50 | 29.57 | 13.98 |
| 2025 | 34.10 | 31.01 | 13.59 |
63. 60% of US consumers in households earning over $150,000 preferred credit cards for in-person payments in 2025 (Federal Reserve, 2026 Findings from the Diary of Consumer Payment Choice). In households under $25,000, 18% preferred credit and 29% preferred cash.
64. 47 payments a month is what the average US consumer made in October 2025 (Federal Reserve, 2026 Findings from the Diary of Consumer Payment Choice). Of those, 16 were credit card payments, 15 debit card payments and six cash payments.
65. $3.21 trillion in US purchases went on Visa consumer debit and prepaid cards in the year to June 2025 (Visa, Form 10-K, fiscal 2025). Visa consumer credit cards handled $2.49 trillion in US purchases over the same period.
In the Federal Reserve’s survey, “buy now, pay later” means paying for a purchase in a few equal payments, usually four.
66. 8.3% of Bank of America households made a buy now, pay later payment in September 2026 (Bank of America Institute, Consumer Checkpoint, October 2026).
67. 16% of US adults used buy now, pay later in 2025, up 1 percentage point from 2024 (Federal Reserve, Economic Well-Being of U.S. Households in 2025: Credit). Use was 12% among adults with incomes of $100,000 or more.
68. 29% of US buy now, pay later users in 2025 said the main reason was that it was the only way they could afford the purchase (Federal Reserve, Economic Well-Being of U.S. Households in 2025: Credit). Among users with incomes under $25,000, the share was 40%.
Credit Card Debt and Household Finances
These figures cover credit card balances, late payments, interest rates and emergency savings.
69. $1.26 trillion was the total US credit card balance at the end of June 2026 (New York Fed, household debt press release, August 2026). Balances rose $21 billion in the quarter and $54 billion over the year.
| Quarter | Credit card balances ($ trillions) |
|---|---|
| Q1 2003 | 0.688 |
| Q2 2003 | 0.693 |
| Q3 2003 | 0.693 |
| Q4 2003 | 0.698 |
| Q1 2004 | 0.695 |
| Q2 2004 | 0.697 |
| Q3 2004 | 0.706 |
| Q4 2004 | 0.717 |
| Q1 2005 | 0.71 |
| Q2 2005 | 0.717 |
| Q3 2005 | 0.732 |
| Q4 2005 | 0.736 |
| Q1 2006 | 0.723 |
| Q2 2006 | 0.739 |
| Q3 2006 | 0.754 |
| Q4 2006 | 0.767 |
| Q1 2007 | 0.764 |
| Q2 2007 | 0.796 |
| Q3 2007 | 0.817 |
| Q4 2007 | 0.839 |
| Q1 2008 | 0.837 |
| Q2 2008 | 0.85 |
| Q3 2008 | 0.858 |
| Q4 2008 | 0.866 |
| Q1 2009 | 0.843 |
| Q2 2009 | 0.824 |
| Q3 2009 | 0.812 |
| Q4 2009 | 0.795 |
| Q1 2010 | 0.7624 |
| Q2 2010 | 0.7444 |
| Q3 2010 | 0.7311 |
| Q4 2010 | 0.7296 |
| Q1 2011 | 0.6964 |
| Q2 2011 | 0.6943 |
| Q3 2011 | 0.6933 |
| Q4 2011 | 0.704 |
| Q1 2012 | 0.6788 |
| Q2 2012 | 0.672 |
| Q3 2012 | 0.674 |
| Q4 2012 | 0.679 |
| Q1 2013 | 0.66 |
| Q2 2013 | 0.668 |
| Q3 2013 | 0.672 |
| Q4 2013 | 0.683 |
| Q1 2014 | 0.659 |
| Q2 2014 | 0.669 |
| Q3 2014 | 0.68 |
| Q4 2014 | 0.7 |
| Q1 2015 | 0.684 |
| Q2 2015 | 0.703 |
| Q3 2015 | 0.714 |
| Q4 2015 | 0.733 |
| Q1 2016 | 0.712 |
| Q2 2016 | 0.729 |
| Q3 2016 | 0.747 |
| Q4 2016 | 0.779 |
| Q1 2017 | 0.764 |
| Q2 2017 | 0.784 |
| Q3 2017 | 0.808 |
| Q4 2017 | 0.834 |
| Q1 2018 | 0.815 |
| Q2 2018 | 0.829 |
| Q3 2018 | 0.844 |
| Q4 2018 | 0.87 |
| Q1 2019 | 0.848 |
| Q2 2019 | 0.868 |
| Q3 2019 | 0.881 |
| Q4 2019 | 0.927 |
| Q1 2020 | 0.893 |
| Q2 2020 | 0.817 |
| Q3 2020 | 0.807 |
| Q4 2020 | 0.819 |
| Q1 2021 | 0.77 |
| Q2 2021 | 0.787 |
| Q3 2021 | 0.804 |
| Q4 2021 | 0.856 |
| Q1 2022 | 0.841 |
| Q2 2022 | 0.887 |
| Q3 2022 | 0.925 |
| Q4 2022 | 0.986 |
| Q1 2023 | 0.986 |
| Q2 2023 | 1.031 |
| Q3 2023 | 1.079 |
| Q4 2023 | 1.129 |
| Q1 2024 | 1.115 |
| Q2 2024 | 1.142 |
| Q3 2024 | 1.166 |
| Q4 2024 | 1.211 |
| Q1 2025 | 1.182 |
| Q2 2025 | 1.209 |
| Q3 2025 | 1.233 |
| Q4 2025 | 1.277 |
| Q1 2026 | 1.242 |
| Q2 2026 | 1.263 |
In the New York Fed’s data, “seriously delinquent” means 90 or more days late, including debts already charged off as bad debt.
70. 12.92% of US credit card balances were 90 or more days late at the end of Q2 2026 (New York Fed, Household Debt and Credit Report, Q2 2026).
71. 6.97% of US credit card balances that were not already seriously delinquent moved into serious delinquency over the four quarters to Q2 2026 (New York Fed, Household Debt and Credit Report, Q2 2026). The rate a year earlier was 6.93%.
72. 21.19% was the average commercial bank credit card interest rate on all accounts in August 2026 (Federal Reserve, G.19 Consumer Credit, October 2026). On accounts that were charged interest, the rate was 22.36%. Both figures are preliminary.
73. In 2025, 45% of US credit card owners said they carried a balance at least once in the prior 12 months (Federal Reserve, Economic Well-Being of U.S. Households in 2025: Credit). In all, 82% of adults had a credit card.
In the Federal Reserve’s survey, “cash or its equivalent” means cash, savings, or a credit card paid off at the next bill.
74. 63% of US adults said they would cover a $400 emergency expense with cash or its equivalent in 2025 (Federal Reserve, Economic Well-Being of U.S. Households in 2025: fact sheet). This share has not changed since 2022.
How Do Consumers Feel About the Economy?
These figures come from regular surveys of how consumers feel about the economy and their finances.
In the University of Michigan’s data, the “Index of Consumer Sentiment” scores five survey questions on finances and the economy against a 1966 baseline.
75. US consumer sentiment stood at 46.3 in October 2026, a preliminary reading, down from 53.6 a year earlier (University of Michigan, Surveys of Consumers, October 2026 preliminary). The September 2026 final reading was 48.1.
| Month | Index of Consumer Sentiment |
|---|---|
| Jan 2020 | 99.8 |
| Feb 2020 | 101 |
| Mar 2020 | 89.1 |
| Apr 2020 | 71.8 |
| May 2020 | 72.3 |
| Jun 2020 | 78.1 |
| Jul 2020 | 72.5 |
| Aug 2020 | 74.1 |
| Sep 2020 | 80.4 |
| Oct 2020 | 81.8 |
| Nov 2020 | 76.9 |
| Dec 2020 | 80.7 |
| Jan 2021 | 79 |
| Feb 2021 | 76.8 |
| Mar 2021 | 84.9 |
| Apr 2021 | 88.3 |
| May 2021 | 82.9 |
| Jun 2021 | 85.5 |
| Jul 2021 | 81.2 |
| Aug 2021 | 70.3 |
| Sep 2021 | 72.8 |
| Oct 2021 | 71.7 |
| Nov 2021 | 67.4 |
| Dec 2021 | 70.6 |
| Jan 2022 | 67.2 |
| Feb 2022 | 62.8 |
| Mar 2022 | 59.4 |
| Apr 2022 | 65.2 |
| May 2022 | 58.4 |
| Jun 2022 | 50 |
| Jul 2022 | 51.5 |
| Aug 2022 | 58.2 |
| Sep 2022 | 58.6 |
| Oct 2022 | 59.9 |
| Nov 2022 | 56.7 |
| Dec 2022 | 59.8 |
| Jan 2023 | 64.9 |
| Feb 2023 | 66.9 |
| Mar 2023 | 62 |
| Apr 2023 | 63.7 |
| May 2023 | 59 |
| Jun 2023 | 64.2 |
| Jul 2023 | 71.5 |
| Aug 2023 | 69.4 |
| Sep 2023 | 67.8 |
| Oct 2023 | 63.8 |
| Nov 2023 | 61.3 |
| Dec 2023 | 69.7 |
| Jan 2024 | 79 |
| Feb 2024 | 76.9 |
| Mar 2024 | 79.4 |
| Apr 2024 | 77.2 |
| May 2024 | 69.1 |
| Jun 2024 | 68.2 |
| Jul 2024 | 66.4 |
| Aug 2024 | 67.9 |
| Sep 2024 | 70.1 |
| Oct 2024 | 70.5 |
| Nov 2024 | 71.8 |
| Dec 2024 | 74 |
| Jan 2025 | 71.7 |
| Feb 2025 | 64.7 |
| Mar 2025 | 57 |
| Apr 2025 | 52.2 |
| May 2025 | 52.2 |
| Jun 2025 | 60.7 |
| Jul 2025 | 61.7 |
| Aug 2025 | 58.2 |
| Sep 2025 | 55.1 |
| Oct 2025 | 53.6 |
| Nov 2025 | 51 |
| Dec 2025 | 52.9 |
| Jan 2026 | 56.4 |
| Feb 2026 | 56.6 |
| Mar 2026 | 53.3 |
| Apr 2026 | 49.8 |
| May 2026 | 44.8 |
| Jun 2026 | 49.5 |
| Jul 2026 | 55.2 |
| Aug 2026 | 51.7 |
| Sep 2026 | 48.1 |
76. US consumers expect prices to rise 4.7% over the next year, as of October 2026, a preliminary reading (University of Michigan, Surveys of Consumers, October 2026 preliminary).
77. The Conference Board’s US Consumer Confidence Index fell to 81.9 in September 2026, from 88.6 in August (The Conference Board, Consumer Confidence Survey, September 2026). The September figure is preliminary.
In The Conference Board’s data, the “Expectations Index” measures what consumers expect for income, business and jobs over the next six months.
78. The Conference Board’s Expectations Index for US consumers fell to 63.6 in September 2026, its third monthly drop in a row (The Conference Board, Consumer Confidence Survey, September 2026). The figure is preliminary.
In Deloitte’s data, the “financial well-being index” combines six measures, such as savings comfort and ability to pay bills.
79. Deloitte’s US financial well-being index stood at 103.4 in August 2026 (Deloitte, State of the US Consumer: September–October 2026). In the same survey, 71% of US consumers surveyed expected higher grocery prices.
NIQ is a consumer research company.
80. 34% of consumers in 31 countries say they are worse off financially than a year ago, NIQ found in 2026 (NIQ, Consumer Outlook: Guide to 2027). 30% say they are better off.
81. 77% of financially challenged consumers in 31 countries blame rising living costs for their worsening finances, NIQ found in 2026 (NIQ, Consumer Outlook: Guide to 2027).
How Are Consumers Changing Their Spending?
These figures show how people have changed, or plan to change, their spending.
82. 31% of US consumers expect to keep buying items with large price increases as usual over the next 12 months, a 2026 survey found (University of Michigan, Gasoline Prices and Expected Consumer Spending). Another 54% plan to cut back on such items and 16% plan to stop buying them, based on 3,492 interviews.
83. 20% of lower-income US consumers in a 2026 survey expect to keep buying items with large price increases as usual, versus 42% of higher-income consumers (University of Michigan, Gasoline Prices and Expected Consumer Spending). Income groups are thirds of the income distribution.
84. 14% of US consumers say now is an OK time to buy big items on credit, as of 2026 (University of Michigan, Gasoline Prices and Expected Consumer Spending). In the same survey, 24% say it is OK to use savings for a major purchase.
85. 62% of US adults switched to cheaper products in response to higher prices in 2025 (Federal Reserve, Economic Well-Being of U.S. Households in 2025: Income and Expenses). In the same survey, 60% used less of a product or stopped using it, and 46% delayed a major purchase.
86. 72% of US consumers surveyed made at least one splurge purchase to treat themselves in August 2026 (Deloitte, ConsumerSignals).
How Much Do Consumers Spend Worldwide?
These figures cover household spending around the world.
In the World Bank’s data, household final consumption expenditure covers what households and nonprofits serving them spend on goods and services.
87. $63.2 trillion is what households worldwide spent on goods and services in 2024, according to World Bank estimates (World Bank, household consumption (current US$)). The figure is in current US dollars and includes nonprofits that serve households.
| Country | 2024 |
|---|---|
| United States | 19.90 |
| China | 7.49 |
| Germany | 2.47 |
| United Kingdom | 2.25 |
| Japan | 2.22 |
| India | 2.12 |
| France | 1.73 |
| Brazil | 1.40 |
| Italy | 1.37 |
| Mexico | 1.29 |
88. Household spending made up 56.6% of world GDP in 2024, according to World Bank estimates (World Bank, household consumption (% of GDP)).
89. Households in China spent $7.49 trillion in 2024, according to World Bank estimates (World Bank, household consumption by country (current US$)). The figure is in current US dollars.
90. Households in India spent $2.12 trillion in 2024, according to World Bank estimates (World Bank, household consumption by country (current US$)).
How Much Do European Households Spend?
These figures cover household spending in the European Union and the United Kingdom.
91. EU households spent €9.34 trillion in 2024 (Eurostat, nama_10_cp18).
92. Housing, water, electricity and fuels took 23.6% of EU household spending in 2024 (Eurostat, nama_10_cp18).
93. Food and non-alcoholic drinks made up 13.2% of EU household spending in 2024 (Eurostat, nama_10_cp18). Transport took 12.7%.
94. EU household spending rose 0.4% in the second quarter of 2026, after adjusting for inflation (Eurostat, namq_10_gdp). It was 1.2% higher than a year earlier.
In Eurostat’s data, “actual individual consumption” means everything households use, including health and education services provided by government and nonprofits.
Eurostat’s index below adjusts for price differences between countries.
95. Germany scored 120 on Eurostat’s index of actual individual consumption per person in 2025, against an EU average of 100 (Eurostat, prc_ppp_ind_1). France stood at 103, Italy at 97 and Spain at 92; the German, French and Spanish figures are provisional.
96. UK household spending rose 0.3% in real terms in the second quarter of 2026 (ONS, Quarterly National Accounts, April to June 2026). It was an estimated 1.2% higher than a year earlier.
97. UK households spent an average of £676.60 a week in the year to March 2025 (ONS, Family spending in the UK, April 2024 to March 2025). The survey covers about 5,000 households.
How Much Do Households Spend in Canada, Asia and Australia?
These figures cover household spending in Canada, China, India, Japan and Australia.
98. Canadian household spending rose 0.8% in the second quarter of 2026 after adjusting for prices (Statistics Canada, The Daily, August 28, 2026). Higher spending on investment services, passenger vehicles and rent led the gain.
In Statistics Canada’s data, “total current consumption” means spending on everyday items such as food, shelter, transport and recreation.
99. Canadian households spent an average of C$76,146 on goods and services in 2023 (Statistics Canada, Table 11-10-0222-01). The Survey of Household Spending covers the provinces and counts all households, including those with no spending in a category.
100. $756 was the average Canadian household’s spending on pets in 2023 (Statistics Canada, Table 11-10-0222-01). The figure covers the 10 provinces and is in Canadian dollars.
101. Australian household spending was 6.8% higher in August 2026 than a year earlier, in current prices (ABS, Monthly Household Spending Indicator, August 2026). It was flat from July.
102. China’s residents spent 29,476 yuan per person on consumption in 2025 (National Bureau of Statistics of China, Households’ Income and Consumption Expenditure in 2025). That was 4.4% more than in 2024.
103. Food, tobacco and liquor took 29.3% of China’s per person consumption spending in 2025 (National Bureau of Statistics of China, Households’ Income and Consumption Expenditure in 2025). Housing took 21.7%.
104. Urban Indians spent an estimated average of Rs 6,996 per person a month in 2023-24 (MoSPI, Household Consumption Expenditure Survey 2023-24 press note). Rural Indians spent Rs 4,122. Both figures leave out free items from welfare programmes.
105. ¥314,001 a month was the average consumption spending of Japanese households of two or more people in 2025 (Statistics Bureau of Japan, Family Income and Expenditure Survey, 2025). That was up 0.9% in real terms.
Conclusion
Consumer spending data comes from many places: national accounts, household surveys, card data and polls. One thing is clear: housing takes the largest share of US household budgets. We’ll update this page as new data comes out.