
57 B2B SEO Stats for 2026
B2B buyers now do most of their research through search engines and AI tools before ever contacting a vendor. That shift has made organic visibility one of the key factors in making the shortlist.
This page collects 57 B2B SEO statistics from original sources — covering buyer search behavior, SEO ROI by industry, AI-driven buying, content marketing, lead generation costs, and technical benchmarks.
Here are the highlights:
Featured B2B SEO statistics
- 94% of B2B buyers use large language models during their buying process. (6sense, 2025 Buyer Experience Report)
- B2B SaaS companies see an average SEO ROI of 702% over three years, breaking even in 7 months. (First Page Sage)
- 95% of B2B marketers now use AI-powered marketing applications. (CMI / MarketingProfs, 16th Annual B2B Content Marketing Report)
- 51% of B2B software buyers now start research with an AI chatbot rather than Google, up from 29% in April 2025. (G2, The Answer Economy)
- Just 10% of leading Technology and SaaS websites pass Core Web Vitals on mobile. (PageSpeed Matters / Chrome UX Report)
- For B2B websites, organic and paid search combined drive 76% of all trackable traffic (2019). (BrightEdge)
B2B Buyer Search Behavior Statistics
B2B purchasing decisions are shaped long before a buyer contacts a vendor. The research phase is where shortlists form and preferences solidify.
1. 95% of B2B buyers purchase from a vendor already on their Day One shortlist. (6sense, 2025 Buyer Experience Report)
2. 82% of B2B tech buyers already have a top product in mind when they create their shortlist. (TrustRadius, “Bridging the Trust Gap”)
3. B2B buyers now contact sellers at 61% of the way through the buying journey, down from 69% in prior years. (6sense, 2025 Buyer Experience Report)
4. 79% of B2B buyer-seller engagements are initiated by the buyer, not the vendor. (6sense, 2025 Buyer Experience Report)
5. B2B buyers average 16 interactions per person with the winning vendor across the buying journey. (6sense, 2025 Buyer Experience Report)
6. 77% of B2B tech buyers read user reviews during their buying journey. (TrustRadius, “Bridging the Trust Gap”)
7. 73% of B2B buyers prefer to purchase online. (Sana Commerce / Sapio Research, B2B Buyer Report 2025)
8. B2B buyers now use 10 or more channels to interact with suppliers, up from five in 2016. (McKinsey & Company, B2B Pulse Survey)
How Is AI Changing B2B Search?
AI tools have reshaped the way B2B buyers discover, evaluate, and select vendors.
9. 94% of B2B buyers use large language models during their buying process. (6sense, 2025 Buyer Experience Report)
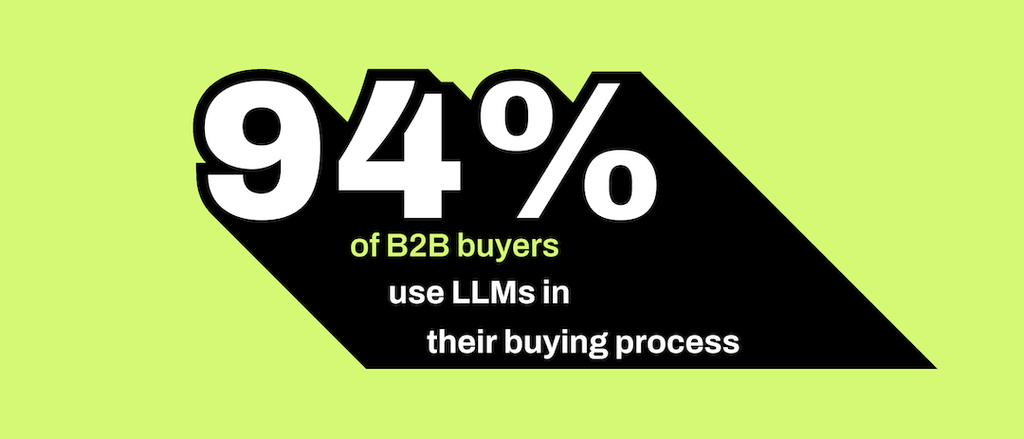
94% of B2B buyers use LLMs
Source: 6sense, 2025 B2B Buyer Experience Report
10. 51% of B2B software buyers now start research with an AI chatbot rather than Google, up from 29% in April 2025. (G2, The Answer Economy)
11. 58% of B2B buyers engaged vendors earlier than usual specifically to evaluate AI capabilities inside solutions. (6sense, 2025 Buyer Experience Report)
12. 72% of B2B tech buyers encounter Google AI Overviews during research. (TrustRadius, “Bridging the Trust Gap”)
13. 90% of B2B tech buyers click through sources cited in AI Overviews for fact-checking. (TrustRadius, “Bridging the Trust Gap”)
14. 45% of B2B buyers used GenAI during a recent purchase, primarily to gather vendor information. (Gartner)
15. 69% of B2B software buyers chose a different vendor than planned based on AI chatbot guidance. (G2, The Answer Economy)
16. 32% of B2B professionals now discover thought leadership content through generative AI tools. (TopRank Marketing / Ascend2, Answer Engine 2026)
17. 63% of B2B tech buyers used AI to research their purchase, but 94% of them fact-check AI answers. (TrustRadius / HG Insights, 2026 B2B Buying Disconnect Report)
18. 69% of B2B buyers prefer to validate AI-generated insights with sales reps. (Gartner)
19. Only 13% of B2B tech buyers used analyst reports in 2026, a 63% decrease since 2022. (TrustRadius / HG Insights, 2026 B2B Buying Disconnect Report)
What ROI Does B2B SEO Deliver?
Organic search remains one of the highest-returning investments in B2B marketing.
20. Financial services firms achieve the highest B2B SEO ROI at 1,031%, with an ROAS of 11.10. (First Page Sage)
21. SEO campaigns in the manufacturing sector deliver an average 813% ROI over three years. (First Page Sage)
22. A thought-leadership SEO campaign produces an average 748% ROI over three years, with an ROAS of 9.10. (First Page Sage)
23. B2B SaaS companies see an average SEO ROI of 702% over three years, breaking even in 7 months. (First Page Sage)
24. Construction companies see the fastest B2B SEO payback, breaking even in just 5 months with a 681% ROI. (First Page Sage)
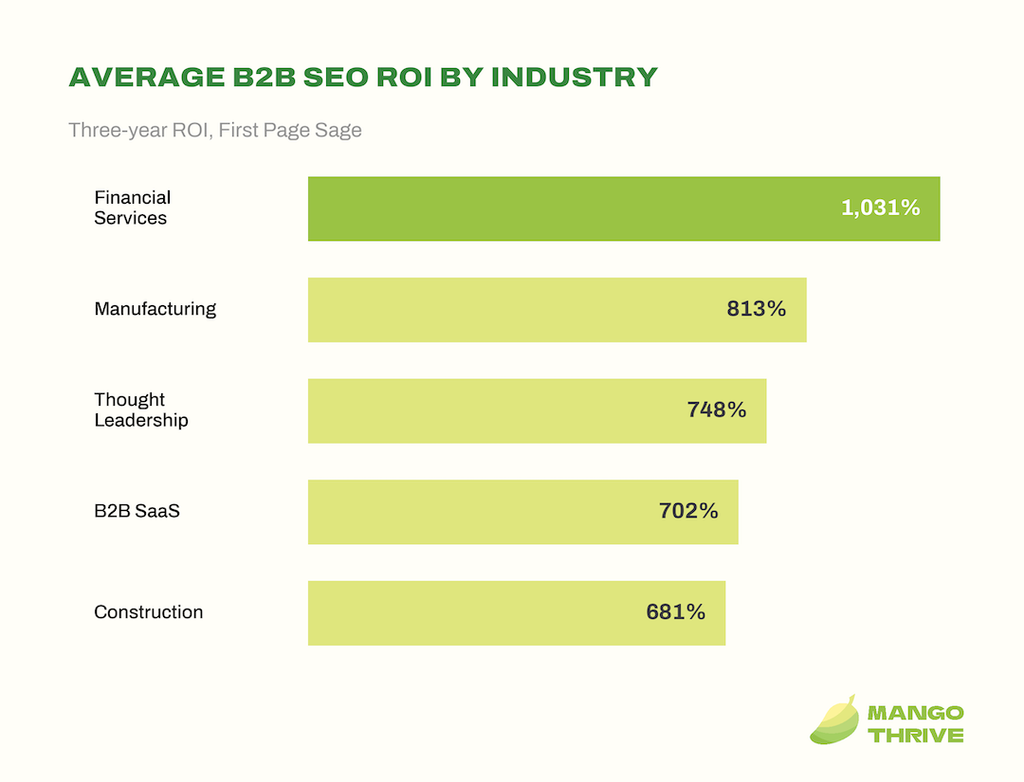
Average B2B SEO ROI by Industry
Source: First Page Sage, SEO ROI Statistics
25. A basic content-marketing SEO campaign returns just 16% ROI and takes 15 months to break even. (First Page Sage)
How Do Organic and Paid Channels Compare?
26. Organic search accounts for 53.3% of all trackable website traffic (2019), making it the single largest digital channel. (BrightEdge)
27. Across all industries, SEO delivers an average conversion rate of 2.4%, compared with 1.3% for PPC. (First Page Sage)
28. B2B SaaS websites convert organic visitors at 2.1%, compared with 1.0% from paid search. (First Page Sage)
29. The average organic customer acquisition cost for B2B SaaS is $205, compared with $341 through paid channels. (First Page Sage)
30. The average organic cost per lead for B2B SaaS is $164, compared with the $310 paid CPL. (First Page Sage)
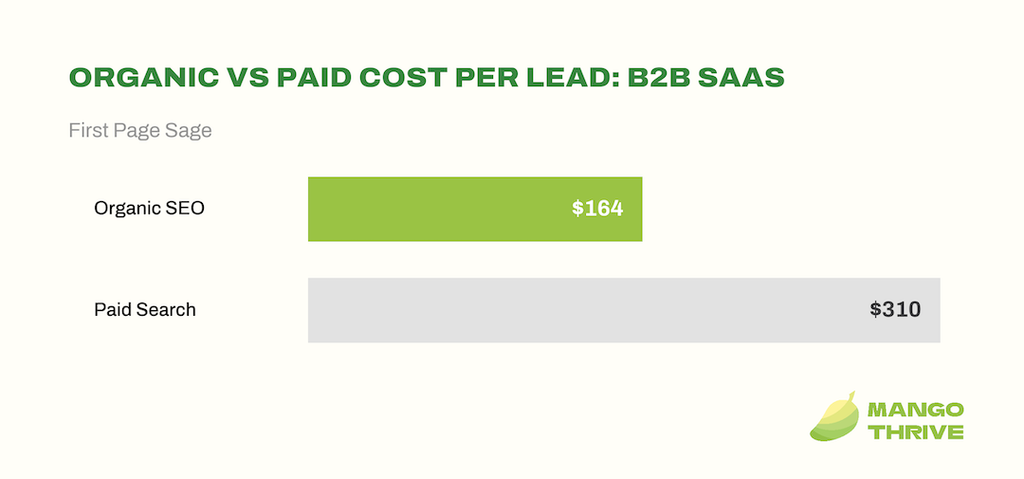
Organic vs Paid Cost Per Lead: B2B SaaS
Source: First Page Sage, Cost Per Lead by Industry
31. The average B2B cost per lead through SEO is $206, ranging from $14 to $397 depending on industry. (Sopro)
B2B Content Marketing Statistics
Content marketing is nearly universal in B2B, but results depend heavily on format, distribution, and the role of AI in the production process.
32. 97% of B2B marketers operate from a content marketing strategy, the highest adoption level in the survey’s 16-year history. (CMI / MarketingProfs, 16th Annual B2B Content Marketing Report)
33. 59% of B2B marketers rate their content marketing as somewhat or highly effective. (CMI / MarketingProfs)
34. 95% of B2B marketers now use AI-powered marketing applications. (CMI / MarketingProfs)
35. 87% of B2B marketers using AI for content creation report a productivity uplift, with 58% saying it improves quality. (CMI / MarketingProfs)
36. 45% of B2B marketers plan to increase investment in AI tools in 2026, making it the top budget priority. (CMI / MarketingProfs)
37. 76% of B2B marketers cite LinkedIn as the most effective distribution channel for thought leadership content. (CMI / MarketingProfs)
38. 78% of B2B marketers say interactive and experiential content increases repeat engagement, but only 33% regularly build it into campaigns. (TopRank Marketing / Ascend2, Answer Engine 2026)
How Much Content Are B2B Buyers Consuming?
39. The average B2B professional took 47.7 hours to consume requested content in 2025, a 23.9% increase year over year. (NetLine, 2026 State of B2B Content Consumption Report)
40. Total B2B gated content demand has grown 57.6% since 2021. (NetLine)
41. AI-related content accounted for 21.1% of all B2B content demand in 2025, climbing 28.5% year over year. (NetLine)
42. B2B eBooks generated roughly 859 registrations per asset in 2025, compared with just 63.5 for white papers. (NetLine, 2026 State of B2B Content Consumption Report)
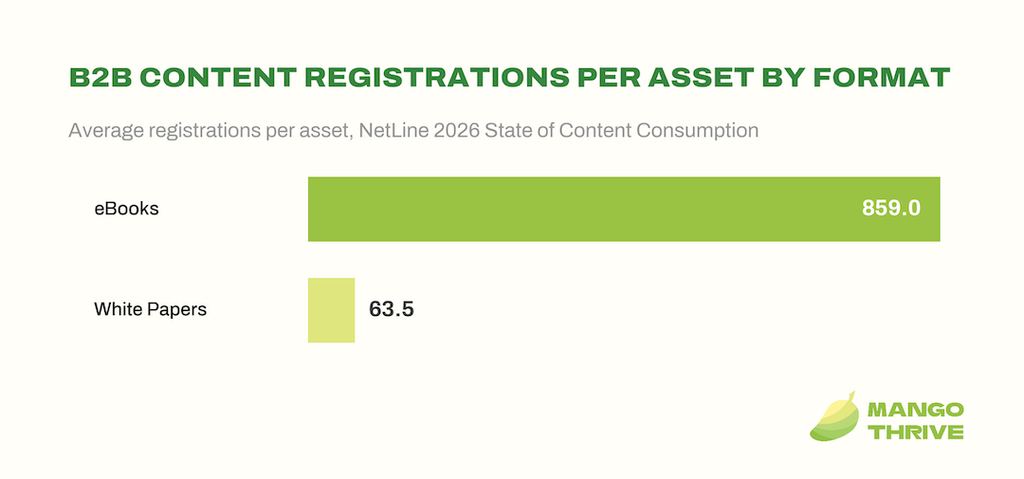
B2B Content Registrations Per Asset by Format
Source: NetLine, 2026 State of B2B Content Consumption Report
B2B Lead Generation and Organic Search
Search is the dominant traffic source for B2B websites, making organic visibility a direct driver of pipeline.
43. For B2B websites, organic and paid search combined drive 76% of all trackable traffic (2019). (BrightEdge)
44. Average B2B website conversion rates range from 1.1% (SaaS) to 7.4% (legal services), across 25 industries. (First Page Sage, B2B Conversion Rates)
45. Marketing budgets remain stagnant or shrinking for 63% of B2B organizations. (Pipeline360, 2025 State of B2B Pipeline Growth)
46. The vendor B2B buyers prefer before engaging sellers still wins 80% of deals. (6sense, 2025 Buyer Experience Report)
47. B2B companies see a 5% to 10% revenue lift from increased content relevance and engagement through personalized go-to-market strategies. (McKinsey & Company, “Future of B2B Sales”)
B2B Technical SEO Benchmarks
Technical performance shapes both search rankings and conversion rates for B2B websites.
48. Only 49.1% of the mobile web passes all three Core Web Vitals as of May 2026. (PageSpeed Matters / Chrome UX Report)
49. Just 10% of leading Technology and SaaS websites pass Core Web Vitals on mobile. (PageSpeed Matters / Chrome UX Report)
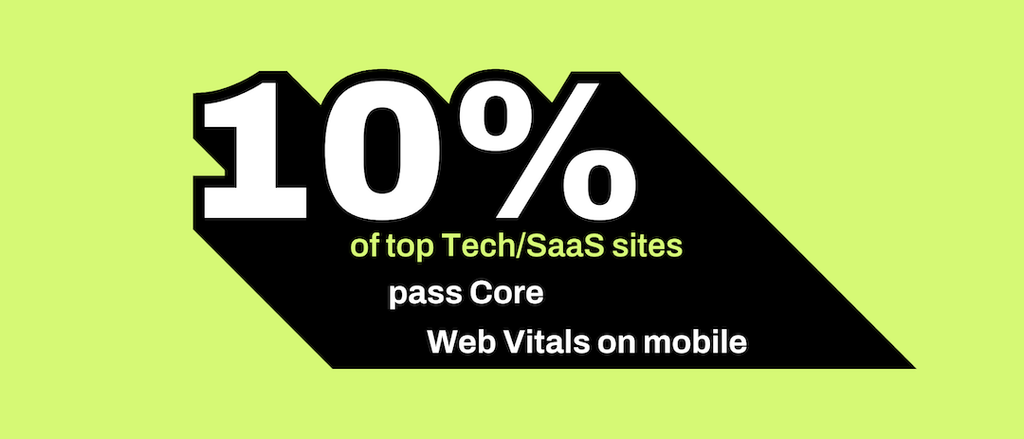
10% of top Tech/SaaS sites pass Core Web Vitals on mobile
Source: PageSpeed Matters / Chrome UX Report, May 2026
50. Desktop websites pass Core Web Vitals at 58.0%, a 9-percentage-point lead over mobile. (PageSpeed Matters / Chrome UX Report)
51. Mobile CWV pass rates have climbed 20 percentage points since 2022, from 28.6% to 49.1%. (PageSpeed Matters / Chrome UX Report)
52. LCP remains the biggest mobile bottleneck — only 64.4% of origins achieve a good Largest Contentful Paint score. (PageSpeed Matters / Chrome UX Report)
53. 82% of B2B pages load in five seconds or less, unchanged since 2019. (Portent)
54. JSON-LD structured data now appears on 41% of web pages, up from 34% in 2022. (HTTP Archive Web Almanac 2024)
How Does Site Speed Affect B2B Conversions?
55. B2B websites that load in one second achieve a conversion rate 3x higher than those loading in five seconds. (Portent)
56. Vodafone found that a 31% improvement in LCP led to 8% more sales in an A/B test. (web.dev / Vodafone case study)
57. A 0.1-second improvement in mobile site speed increased users reaching the lead-generation form page by 21.6%. (Deloitte / Google / 55, “Milliseconds Make Millions”)
Conclusion
That wraps up this list of B2B SEO statistics. The broader trend is clear: buyers are researching independently — through search and increasingly through AI — and the companies visible during that phase are the ones winning deals.
This page is updated regularly as new data comes out.