
The auto industry is changing on several fronts at once. Electric cars and hybrids are taking a bigger share of new car sales. Tariffs have added costs for automakers that ship cars and parts across borders. US buyers face high prices and large loans. Here are the latest statistics on production, sales, prices, electric vehicles, trade, jobs and the biggest automakers.
Top Automotive Industry Statistics
- 96.4 million motor vehicles were produced worldwide in 2025, up 3.9% from 92.7 million in 2024 (OICA, 2025 production and sales release).
- 99.8 million new motor vehicles were sold worldwide in 2025, up 4.7% from 95.3 million in 2024 (OICA, 2025 production and sales release).
- 10.67 million new light vehicles were sold in the US from January to August 2026, down from 10.97 million a year earlier (BEA, Motor Vehicle Unit Retail Sales, Table 6).
- $50,089 was the average transaction price of a new vehicle in the US in August 2026 (Kelley Blue Book, August 2026 ATP Report).
- More than 20 million electric cars were sold worldwide in 2025, one in four new cars (IEA, Global EV Outlook 2026).
- $422.0 billion of automotive vehicles, parts and engines were imported into the US in 2025 (U.S. Census Bureau & BEA, FT-900 Annual Revision 2025, Exhibits 6–7).
- 962,800 jobs were in US motor vehicle and parts manufacturing in August 2026 (BLS, Automotive Industry: Employment, Earnings, and Hours). That was 400 fewer than a year earlier, based on preliminary, seasonally adjusted data.
- 11,322,575 vehicles were sold worldwide by the Toyota group, including Daihatsu and Hino, in 2025 (Toyota Motor Corporation, Sales, Production, and Export Results for 2025).
How Big Is the Global Automotive Industry?
These figures from OICA, the international association of vehicle makers, count cars, trucks and buses made and sold worldwide.
1. 96.4 million motor vehicles were produced worldwide in 2025, up 3.9% from 92.7 million in 2024 (OICA, 2025 production and sales release).

Vehicles produced worldwide in 2025
Source: OICA, 2025 production and sales release.
2. 99.8 million new motor vehicles were sold worldwide in 2025, up 4.7% from 95.3 million in 2024 (OICA, 2025 production and sales release).
Global Car Production and Sales Estimates
These figures from ACEA and S&P Global Mobility count passenger cars or light vehicles only.
3. 78.7 million passenger cars were produced worldwide in 2025, up 4.2% on 2024 (ACEA, Economic and Market Report Full year 2025). The 2025 figures are provisional.
4. 77.6 million new passenger cars were registered worldwide in 2025, a 3.5% increase on 2024 (ACEA, Economic and Market Report Full year 2025). The 2025 figures are provisional.
5. 89.4 million light vehicles are expected to be sold worldwide in 2026, down 2.7% from 91.9 million in 2025 (S&P Global Mobility, June 2026 forecast). This forecast was published in June 2026.
Which Countries Make the Most Vehicles?
These figures show vehicle production by country and region, plus China’s output so far this year.
6. 34.53 million vehicles were produced in China in 2025, up 10% from 2024 (OICA, World Motor Vehicle Production by Country/Region 2025).
| Country | Vehicles produced, 2025 | Change vs 2024 |
|---|---|---|
| China | 34,530,738 | 10% |
| US | 10,243,844 | -3% |
| Japan | 8,410,232 | 2% |
| India | 6,490,810 | 8% |
| Germany (cars only) | 4,148,836 | 2% |
| South Korea | 4,102,200 | -1% |
| Mexico | 4,092,448 | -3% |
| Brazil | 2,644,054 | 4% |
| Spain | 2,274,026 | -4% |
| France (cars and light commercial vehicles only) | 1,463,991 | 8% |
| Thailand | 1,455,569 | -1% |
| Czechia | 1,452,776 | 0% |
Source: OICA, World Motor Vehicle Production by Country/Region 2025. Germany counts cars only; France counts cars and light commercial vehicles only. Some cells are OICA estimates, and some manufacturers do not report in some countries.
7. About 59.2 million vehicles were made in the Asia-Pacific region in 2025, up 7.6% and more than 61% of global output (OICA, 2025 production and sales release). Sales across Asia, Oceania and the Middle East rose 7.1% to 55.02 million units.
8. 17.2 million vehicles were produced in Europe in 2025, down 0.8%, while sales slipped 0.4% to 18.63 million (OICA, 2025 production and sales release).
9. 18.74 million vehicles were produced across the Americas in 2025, down 2.1%, while sales rose 2.9% to 24.86 million (OICA, 2025 production and sales release).
10. 58.2 million vehicles were made in emerging countries in 2025, up 8%, against 38.2 million in developed ones, down 1% (OICA, World Motor Vehicle Production by Country/Region 2025). OICA counts the EU15, the US, Canada, Mexico, Japan, South Korea and Australia as developed.
11. 20.255 million vehicles were produced in China from January to August 2026, down 3.8% year on year (CAAM, August 2026 production and sales brief). Sales over the same months, including exports, were 20.315 million, also down 3.8%.
Are Car Sales Dropping in the US?
These figures cover new car and light truck sales in the US.
In BEA’s sales data, “light vehicles” are autos plus light trucks. BEA defines light trucks as trucks up to 14,000 pounds gross vehicle weight, including minivans and SUVs.
12. 10.67 million new light vehicles were sold in the US from January to August 2026, down from 10.97 million a year earlier (BEA, Motor Vehicle Unit Retail Sales, Table 6). The figures are not seasonally adjusted.
13. 16.26 million new light vehicles were sold in the US in 2025, up from 15.85 million in 2024 (BEA, Motor Vehicle Unit Retail Sales, Table 6). The figures count cars and light trucks, before seasonal adjustment.
A seasonally adjusted annual rate shows how many vehicles would sell in a full year if one month’s pace held, after removing normal seasonal swings.
14. 16.76 million was the seasonally adjusted annual rate of US light vehicle sales in August 2026 (BEA, Motor Vehicle Unit Retail Sales, Table 6). Including heavy trucks, the rate was 17.19 million.
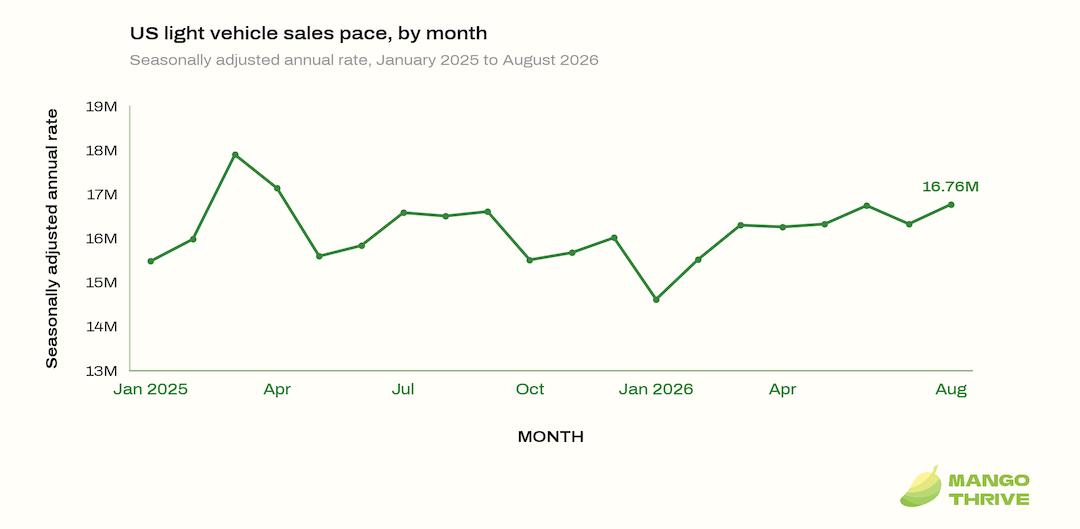
US light vehicle sales pace by month, January 2025 to August 2026
Source: BEA, Motor Vehicle Unit Retail Sales, Table 6.
15. 13.53 million light trucks were sold in the US in 2025, against 2.73 million cars (BEA, Motor Vehicle Unit Retail Sales, Table 6).
16. 16.1 million new vehicles are forecast to be sold in the US in 2026, per Cox Automotive’s September 2026 outlook (Cox Automotive, Sept. 24, 2026 forecast). Cox raised this forecast from 15.8 million.
17. 2.68 million new vehicles were in available US inventory in August 2026, down from 2.73 million in July (Cox Automotive, August 2026 new-vehicle inventory report).
Days’ supply shows how many days current inventory would last at the current sales pace.
18. 73 days’ supply of new vehicles was available in the US in August 2026, the lowest since April 2025 (Cox Automotive, August 2026 new-vehicle inventory report). A year earlier it was 75 days.
How Many Vehicles Are on US Roads?
These figures cover how many vehicles are registered in the US and how old they are.
19. 297.5 million motor vehicles were registered in the US in 2024, per the Federal Highway Administration (FHWA, Highway Statistics 2024, Table MV-1). That count includes 189.8 million trucks, 97.4 million automobiles and 9.3 million motorcycles.
20. 12.8 years was the average age of US light vehicles in S&P Global Mobility’s 2025 analysis (S&P Global Mobility, May 21, 2025). Light vehicles in operation grew to 289 million.
How Much Do Cars Cost in the US?
These figures cover what buyers pay for new and used vehicles in the US.
In Kelley Blue Book’s data, “average transaction price” (ATP) means the average price buyers actually paid for new vehicles, weighted by sales volume, so best-selling models count more.
21. $50,089 was the average transaction price of a new vehicle in the US in August 2026 (Kelley Blue Book, August 2026 ATP Report). That was 1.9% higher than in August 2025.
Incentives are the discounts and deals automakers offer buyers.
22. 6.5% of the average new-vehicle transaction price went to incentives in the US in August 2026 (Kelley Blue Book, August 2026 ATP Report). A year earlier, the share was 7.2%.
23. $54,813 was the average transaction price of a new electric vehicle in the US in August 2026 (Kelley Blue Book, August 2026 ATP Report). That was down 2.7% from a year earlier.
In the Cox Automotive/Moody’s Analytics “Vehicle Affordability Index,” affordability means how many weeks of median household income it takes to buy the average new vehicle, with the interest rate based on a 72-month fixed-rate loan.
24. 35.5 weeks of median income were needed to buy the average new vehicle in the US in August 2026 (Cox Automotive/Moody’s Analytics Vehicle Affordability Index, August 2026). A year earlier, it took 35.9 weeks.
25. 0.6% was the 12-month rise in US consumer prices for new vehicles in August 2026 (BLS, Consumer Price Index, August 2026). Prices for used cars and trucks fell 2.3% over the same period.
26. $12,863 a year is the average cost to own and operate a new vehicle in the US in 2026, per AAA (AAA, Your Driving Costs 2026). AAA estimates costs over five years and 75,000 miles, including fuel, maintenance, taxes, depreciation and finance charges.
27. $27,239 was the average listing price of a used vehicle at US dealers in August 2026 (Cox Automotive, August 2026 used-vehicle inventory report). That was 7% above a year earlier.
How Much Do Americans Borrow for Cars?
These figures cover car loans, monthly payments and auto debt in the US.
28. $44,156 was the average amount financed on a new-vehicle purchase in the US in Q2 2026 (Edmunds, Q2 2026 vehicle financing data). Edmunds says it is an all-time high.
29. $777 was the average monthly payment on a financed new vehicle in the US in Q2 2026 (Edmunds, Q2 2026 vehicle financing data). Edmunds calls it a record.
30. One in five new-vehicle buyers who financed in the US in Q2 2026 had monthly payments of $1,000 or more (Edmunds, Q2 2026 vehicle financing data). The exact share was 20.3%, tying the record from Q4 2025.
31. $1.71 trillion was the total auto loan debt owed by US households at the end of Q2 2026 (New York Fed, Household Debt and Credit Report Q2 2026). Balances rose by $28 billion in the quarter.
32. An annualized 3.00% of US auto loan balances moved into serious delinquency, 90 or more days late, in Q2 2026 (New York Fed, Household Debt and Credit Report Q2 2026). The rate was 2.93% a year earlier.
How Many Electric Cars Are Sold Worldwide?
These figures from the International Energy Agency (IEA) cover electric car sales worldwide and by region. Plug-in hybrids have a battery that charges from the grid and a gasoline engine.
In the IEA’s data, “electric car” means both fully battery-powered cars and plug-in hybrids, but not hydrogen fuel-cell cars.
33. More than 20 million electric cars were sold worldwide in 2025, one in four new cars (IEA, Global EV Outlook 2026). Sales grew by 20% on the year.
34. 23 million electric cars are expected to be sold worldwide in 2026, 28% of all car sales (IEA, Global EV Outlook 2026).
35. More than 13 million electric cars were sold in China in 2025, almost 55% of its car sales (IEA, Global EV Outlook 2026). China accounted for six out of ten electric cars sold worldwide.
36. 4.2 million electric cars were sold in Europe in 2025, 28% of all new cars (IEA, Global EV Outlook 2026). That was 1 million more than in 2024.
37. About 1.5 million electric cars were sold in the US in 2025, slightly fewer than in 2024 (IEA, Global EV Outlook 2026). Fourth-quarter sales were 45% lower than a year earlier, after tax credits for new and used electric cars ended in September 2025.
A terawatt-hour (TWh) is a unit of energy. Here it measures the capacity of batteries put into vehicles.
38. 1.2 TWh of batteries went into electric vehicles worldwide in 2025, up almost 30% on 2024 (IEA, Global EV Outlook 2026).
EV and Hybrid Sales in the US
These figures from Cox Automotive cover electric vehicle and hybrid sales in the US. Hybrids have a gasoline engine and an electric motor but do not plug in.
39. An estimated 247,226 new EVs were sold in the US in the second quarter of 2026, down 20.5% from a year earlier (Cox Automotive, Q2 2026 EV Sales Report). Sales were up 14.7% from the first quarter.
40. About 5.8% of new vehicles sold in the US in Q2 2026 were EVs (Cox Automotive, Q2 2026 EV Sales Report). The record was 10.6% in Q3 2025.
41. A record 16.3% of new US vehicles in Q2 2026 were hybrids, up from 13.0% a year earlier (Cox Automotive, Q3 2026 Sales Forecast Update transcript). Hybrid volume rose 23% year over year.
Electric and Hybrid Cars in the EU and China
These figures cover new car registrations in the EU and new energy vehicle sales in China.
In ACEA’s data, “hybrid-electric” cars include both full hybrids and mild hybrids.
42. 21.7% of new cars registered in the EU from January to August 2026 were battery-electric (ACEA, New car registrations August 2026). The share was 15.8% a year earlier.
43. 36.6% of new EU car registrations from January to August 2026 were hybrid-electric, the most popular powertrain (ACEA, New car registrations August 2026).
44. 10% of new EU car registrations from January to August 2026 were plug-in hybrids, up from 8.8% a year earlier (ACEA, New car registrations August 2026).
45. 21.7% of new EU car registrations from January to August 2026 were petrol cars, down from 28% a year earlier (ACEA, New car registrations August 2026). Diesel cars made up 7.3%, down from 9.4%.
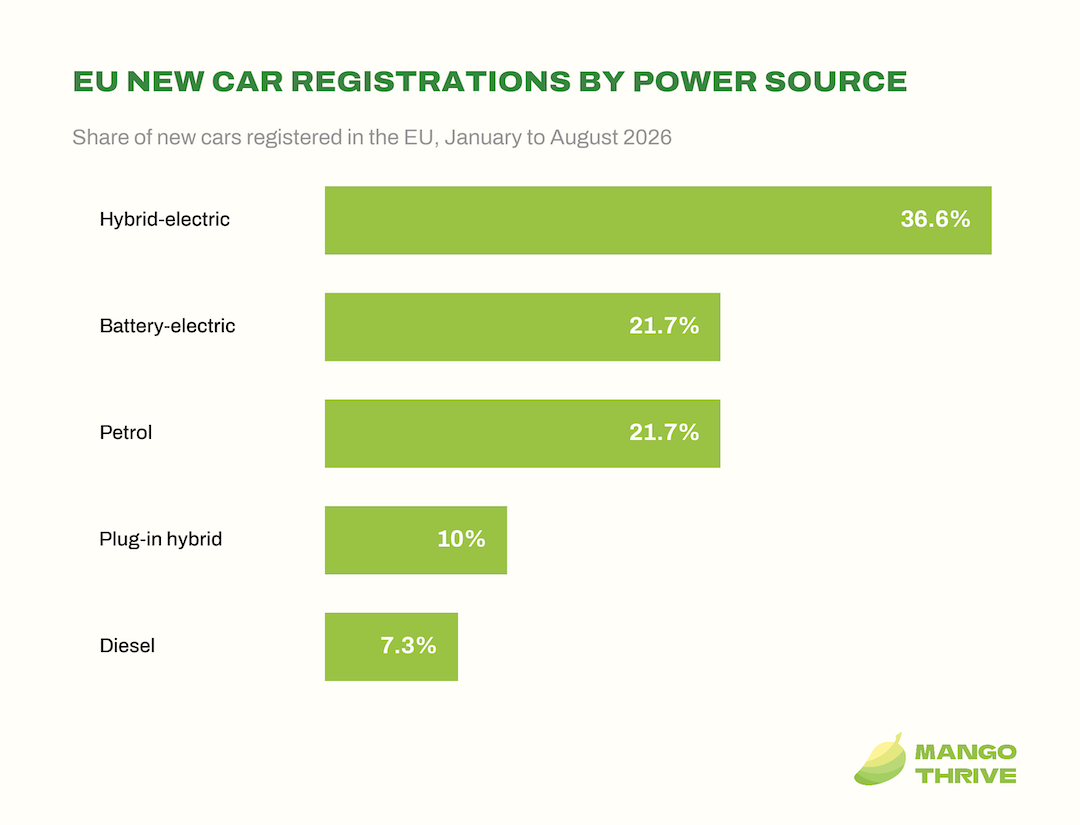
Share of new EU car registrations by power source, January to August 2026
Source: ACEA, New car registrations August 2026. Other power sources are not shown.
New energy vehicles is China’s term for battery-electric, plug-in hybrid and fuel-cell vehicles.
46. 16.49 million new energy vehicles were sold by carmakers in China in 2025, up 28.2% from 2024 (CAAM, December 2025 NEV brief). The count includes exports.
47. 2.615 million new energy vehicles were exported from China in 2025, double the 2024 level (CAAM, December 2025 NEV brief).
48. 10.65 million new energy vehicles were sold by carmakers in China from January to August 2026, up 10.7% from a year earlier (CAAM, August 2026 industry brief).
How Much Does the US Import and Export in Autos?
These figures come from US government trade data.
49. $422.0 billion of automotive vehicles, parts and engines were imported into the US in 2025 (U.S. Census Bureau & BEA, FT-900 Annual Revision 2025, Exhibits 6–7). That was down from $473.3 billion in 2024.
50. $168.4 billion of US motor vehicle and parts imports came from Mexico in 2025 (U.S. Census Bureau & BEA, FT-900 Annual Revision 2025, Exhibit 17). Imports from Canada were $52.3 billion, Japan $50.8 billion, South Korea $42.1 billion and Germany $29.3 billion.
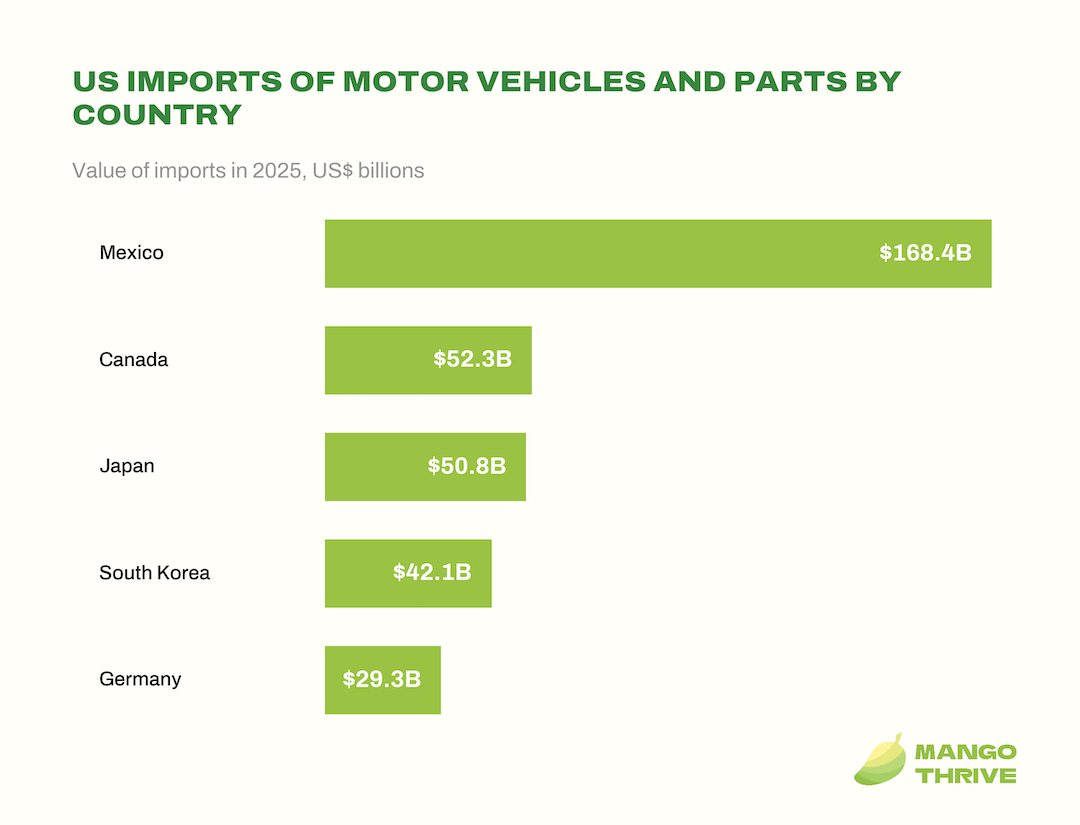
US imports of motor vehicles and parts by country, 2025
Source: U.S. Census Bureau & BEA, FT-900 Annual Revision 2025, Exhibit 17.
51. $160.3 billion of US automotive vehicles, parts and engines were exported in 2025 (U.S. Census Bureau & BEA, FT-900 Annual Revision 2025, Exhibits 6–7). That was down from $172.9 billion in 2024.
Vehicle Exports From China, Japan, Mexico and the EU
These figures cover vehicle exports from major producing countries and the EU’s car trade.
52. 7.098 million vehicles were exported by China in 2025, up 21.1% on 2024 (China Association of Automobile Manufacturers, December 2025 export analysis).
53. 5.9 million motor vehicles were exported from Japan in 2025, worth 17.6 trillion yen (Ministry of Finance Japan, Trade Statistics 2025). Vehicles made up 16.0% of Japan’s goods exports by value.
54. 3.39 million light vehicles were exported from Mexico in 2025, down 2.7% on 2024, according to preliminary INEGI data (INEGI, RAIAVL December 2025 report). The US took 78.4% of those exports.
In ACEA’s trade data, “new car trade” means new passenger cars and similar people-carrying vehicles, not buses or minibuses for ten or more people.
55. €76 billion was the EU’s trade surplus in new cars in 2025, its lowest since 2021 (ACEA, Economic and Market Report – Full year 2025). EU new car exports were worth €147.9 billion and imports €71.9 billion.
What Are US Tariffs on Imported Cars?
These figures show US tariff rates on imported cars and parts, as set out in official government notices.
56. 25% is the US tariff on imported cars under Proclamation 10908, in force since April 3, 2025 (Proclamation 10908, Federal Register 90 FR 14705). The same rate applies to covered auto parts from no later than May 3, 2025, on top of other duties.
57. 15% is the combined US tariff on cars and auto parts from Japan from September 16, 2025, under the 2025 US-Japan agreement (U.S. Department of Commerce notice, 90 FR 44638). Goods whose normal duty is already 15% or more pay no extra auto tariff.
58. 15% is the combined US tariff on EU cars and auto parts entered from August 1, 2025 (Commerce & USTR notice, 90 FR 46136). Goods whose normal duty is already 15% or more pay no extra auto tariff.
59. 15% is the combined US tariff on South Korean cars and auto parts from November 1, 2025 (Commerce notice, 90 FR 55964). Goods whose normal duty is already 15% or more pay no extra auto tariff.
How Much Have Tariffs Cost Automakers?
These figures show what automakers reported as the cost of US tariffs.
In General Motors’ reporting, “EBIT-adjusted” means earnings before automotive interest and income taxes, also leaving out items GM does not count as core operations.
60. $3.1 billion was the tariff hit to GM’s adjusted operating profit (EBIT-adjusted) in 2025 (General Motors, Form 10-K 2025).
61. About $2 billion was the net tariff hit to Ford’s earnings before interest and taxes (EBIT) in 2025, after offsets (Ford Motor Co., Form 10-K 2025). Gross tariff costs were about $3 billion, covering tariffs implemented or revised in 2025.
62. 1.38 trillion yen was the impact of US tariffs on Toyota’s operating income in the fiscal year ended March 2026 (Toyota Motor Corporation, FY2026 Financial Results presentation).
63. €2.9 billion in extra costs hit Volkswagen Group in 2025 in connection with higher US import tariffs (Volkswagen Group, Annual Report 2025).
How Many People Work in the Auto Industry?
These figures cover jobs, pay and economic output in the auto industry in the US, the EU, Japan and Canada.
64. 10.95 million US jobs were tied to the auto industry in 2023, per a model by the Alliance for Automotive Innovation, an auto industry trade group (Alliance for Automotive Innovation, Economic Insights). The estimate covers making, selling, repairing and renting vehicles, modeled with IMPLAN software.
In BLS data, the “automotive industry” means a group of industries that make, wholesale, sell and repair motor vehicles. It is not an official single industry code.
65. 962,800 jobs were in US motor vehicle and parts manufacturing in August 2026 (BLS, Automotive Industry: Employment, Earnings, and Hours). That was 400 fewer than a year earlier, based on preliminary, seasonally adjusted data.
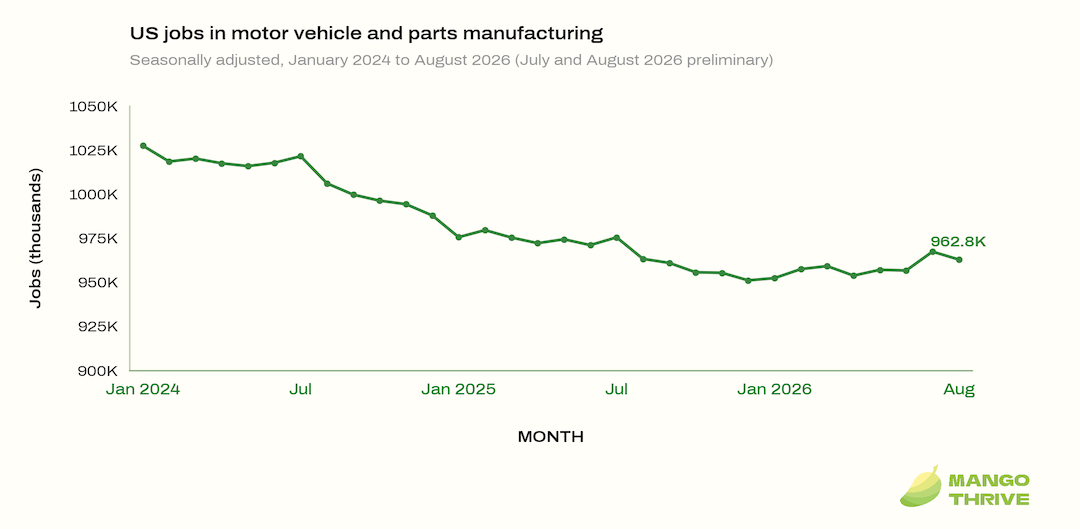
US jobs in motor vehicle and parts manufacturing, January 2024 to August 2026
Source: BLS, CES series CES3133600101. July and August 2026 are preliminary.
66. About 2.05 million jobs were at US motor vehicle and parts dealers in August 2026 (BLS, Automotive Industry: Employment, Earnings, and Hours). That was 4,700 more than a year earlier, based on preliminary, seasonally adjusted data.
67. 1,045,000 jobs were in US automotive repair and maintenance in July 2026 (BLS, Automotive Industry: Employment, Earnings, and Hours). The figure is preliminary and not seasonally adjusted.
68. $33.71 an hour was the average pay of production and nonsupervisory workers in US motor vehicle and parts manufacturing in August 2026 (BLS, Automotive Industry: Employment, Earnings, and Hours). The figure is preliminary, not seasonally adjusted and $1.24 higher than a year earlier.
69. $50,620 was the median annual wage for US automotive service technicians and mechanics in May 2025 (BLS, Occupational Outlook Handbook). Half of these workers earned more than this amount and half earned less.
70. $183.97 billion in value added came from US motor vehicle, body, trailer and parts manufacturing in 2025 (BEA, Value Added by Industry, June 2026). Value added is the industry’s contribution to GDP, in current dollars.
71. 0.6% of US GDP came from motor vehicle, body, trailer and parts manufacturing in 2025 (BEA, Value Added by Industry as a Percentage of GDP, June 2026).
In ACEA’s data, “indirect” automotive jobs are jobs in related manufacturing, vehicle use (such as sales, repair and rental), transport and construction, on top of direct manufacturing jobs.
72. 13.6 million jobs in the EU were linked to the auto sector in 2023, or 6.9% of EU employment (ACEA, Pocket Guide 2025/2026). The count includes direct and indirect jobs in manufacturing, services and construction, and the data are provisional.
73. About 2.5 million people worked directly in EU automotive manufacturing in 2023, 8.1% of EU manufacturing jobs (ACEA, Pocket Guide 2025/2026). The figure is provisional and based on Eurostat data.
74. 5.59 million people in Japan work in auto manufacturing and auto-related industries, 8.2% of the workforce, according to JAMA’s 2025 report (JAMA, The Motor Industry of Japan 2025). About 889,000 of them work in automobile production, which JAMA counts as vehicle (including motorcycle), parts, and body and trailer manufacturing.
75. 36,533 employees worked in Canadian motor vehicle manufacturing in July 2026 (Statistics Canada, Table 14-10-0201-01). Another 65,070 worked in motor vehicle parts manufacturing, not seasonally adjusted.
How Many Vehicles Do the Major Automakers Sell?
These figures come from each automaker’s own sales reports. Each company uses its own measure: sales, deliveries or shipments.
In Toyota’s data, “worldwide sales” means sales in Japan plus sales outside Japan, and what counts as a sale outside Japan varies by country.
76. 11,322,575 vehicles were sold worldwide by the Toyota group, including Daihatsu and Hino, in 2025 (Toyota Motor Corporation, Sales, Production, and Export Results for 2025). Toyota’s own table marks this as a record high for a full year.
77. 8.98 million vehicles were delivered worldwide by the Volkswagen Group in 2025, down 0.5% from 2024 (Volkswagen Group, “Volkswagen Group deliveries remain stable in 2025”).
78. 4,108,605 vehicles were sold at retail worldwide by Hyundai Motor Company in 2025, up 2% from 2024 (Hyundai Motor Company, 2025 Global Retail Sales Results).
79. 3,135,803 vehicles were sold worldwide by Kia in 2025, a new annual record for the company (Kia Corporation, Global Sales Record for 2025). Kia says this was up 2% from 2024.
In Stellantis’s reporting, “consolidated shipments” means vehicles shipped by its consolidated subsidiaries, including vehicles made by its joint ventures and associates that those subsidiaries distribute.
80. 5,484,000 vehicles were shipped by Stellantis’s consolidated subsidiaries in 2025, up 1% from 2024 (Stellantis, Full Year 2025 Results).
81. 4,602,436 new energy vehicles were sold by BYD in 2025, up 7.73% from 2024 (BYD, Production and Sales Volume for December 2025, HKEX filing). BYD notes the figures are unaudited.
82. 2,256,714 battery electric passenger cars were sold by BYD in 2025, up 27.86% from 2024 (BYD, Production and Sales Volume for December 2025, HKEX filing).
83. 1,636,129 vehicles were delivered by Tesla in 2025 (Tesla, Fourth Quarter 2025 Production, Deliveries & Deployments).
84. 480,126 vehicles were delivered by Tesla in the second quarter of 2026 (Tesla, Second Quarter 2026 Production, Deliveries & Deployments). Tesla produced 451,758 vehicles in the same quarter.
How Much of the US Market Do the Detroit Three Hold?
The Detroit Three are General Motors, Ford and Stellantis. These figures cover the Detroit Three’s share of US sales and the US sales of GM, Ford, Stellantis, Toyota and Hyundai.
85. Just over 36% of US new-vehicle sales in Q3 2026 are forecast to go to Detroit Three brands, the lowest level on record, per Cox Automotive (Cox Automotive, Sept. 24, 2026 forecast). Asian brands are expected to take more than half of sales.
86. 2.85 million vehicles were sold by General Motors in the US in 2025, up 6% (General Motors, 2025 U.S. Fourth-Quarter and Full-Year Sales). GM says its US market share rose to about 17%.
87. 2,204,124 vehicles were sold in the US by Ford in 2025, up 6.0% (Ford, 2025 Full-Year U.S. Sales Results). Ford puts its US market share at 13.2%.
88. 1,260,344 vehicles were sold in the US by Stellantis’s FCA US in 2025, down 3% from 2024 (FCA US, Full-year 2025 US Sales Results).
89. 2,518,071 vehicles were sold in the US by Toyota Motor North America in 2025, up 8.0% (Toyota Motor North America, 2025 U.S. Sales Results). Electrified models made up 47.0% of that volume.
90. 901,686 vehicles were sold in the US by Hyundai Motor America in 2025, its third straight annual record (Hyundai Motor America, 2025 Sales Release).
How Much Revenue Do Automakers Make?
These figures come from each automaker’s latest annual results.
91. ¥50.68 trillion in sales revenue was reported by Toyota for the fiscal year ended March 31, 2026, up 5.5% (Toyota Motor Corporation, FY2026 Financial Summary). Operating income fell 21.5% to ¥3.77 trillion.
92. €321.9 billion in sales revenue was generated by the Volkswagen Group in 2025, versus €324.7 billion in 2024 (Volkswagen Group, Annual Report 2025). Its operating result was €8.9 billion, down from €19.1 billion.
93. $185.0 billion in revenue was reported by General Motors for 2025, down 1.3% from 2024 (General Motors, Q4 and Full-Year 2025 Results). Net income attributable to stockholders was $2.7 billion.
94. $187.3 billion in revenue was reported by Ford for 2025, its fifth straight year of revenue growth (Ford Motor Company, Fourth-Quarter, Full-Year 2025 Results). Ford posted a full-year net loss of $8.2 billion.
95. €153.5 billion in net revenues was reported by Stellantis for 2025, down 2% from 2024 (Stellantis, Full Year 2025 Results). It posted a net loss of €22.3 billion after €25.4 billion of unusual charges.
96. $69.5 billion in automotive revenue was reported by Tesla for 2025, down from $77.1 billion in 2024 (Tesla, Form 10-K for 2025). Total revenue was $94.8 billion.
97. About 804 billion yuan in revenue was recorded by BYD in 2025, up 3.46% from 2024 (BYD, 2025 Annual Results Announcement, HKEX filing). Net profit attributable to shareholders fell 18.97%.
Conclusion
One thing is clear: the auto industry is moving in different directions in different places. Vehicle production grew in Asia last year and slipped in Europe and the Americas. Electric cars are gaining ground in China and Europe, and hybrids are growing fast in the US. We’ll update this page as new data comes out.