How many people work at NVIDIA?
NVIDIA employs approximately 42,000 people worldwide as of fiscal year 2026, according to the company’s most recent 10-K filing with the U.S. Securities and Exchange Commission. This represents a 16.67% increase from the previous fiscal year and roughly a 1,000x increase since the company’s founding.
Key NVIDIA Employee Statistics (2026)
- Total employees: 42,000 (FY2026)
- Year-over-year growth: +6,000 employees (+16.67%)
- Workforce growth since 1996: 1,000x (from 42 to 42,000)
- Gender split (FY2025): 21.2% women, 77.5% men
- Largest workforce region: Americas (~49.7%)
- Voluntary turnover rate (FY2025): 2.5% — down from 13.0% in FY2016
How many people work at NVIDIA? Latest numbers in 2026
The latest data on NVIDIA’s workforce for 2026, sourced from the 10-K report, shows that there are 42,000 employees currently working at NVIDIA.
Source: SEC
NVIDIA Employee Count Over the Years
| Fiscal Year | Employees | YoY Change (#) | YoY Growth (%) |
| FY1996 | 42 | — | — |
| FY1997 | 92 | 50 | 119.05% |
| FY1999 | 248 | 156 | 169.57% |
| FY2000 | 392 | 144 | 58.06% |
| FY2001 | 796 | 404 | 103.06% |
| FY2002 | 1,123 | 327 | 41.08% |
| FY2003 | 1,513 | 390 | 34.73% |
| FY2004 | 1,825 | 312 | 20.62% |
| FY2005 | 2,101 | 276 | 15.12% |
| FY2006 | 2,737 | 636 | 30.27% |
| FY2007 | 4,083 | 1,346 | 49.18% |
| FY2008 | 4,985 | 902 | 22.09% |
| FY2009 | 5,420 | 435 | 8.73% |
| FY2010 | 5,706 | 286 | 5.28% |
| FY2011 | 6,029 | 323 | 5.66% |
| FY2012 | 7,133 | 1,104 | 18.31% |
| FY2013 | 7,974 | 841 | 11.79% |
| FY2014 | 8,808 | 834 | 10.46% |
| FY2015 | 9,228 | 420 | 4.77% |
| FY2016 | 9,227 | -1 | -0.01% |
| FY2017 | 10,299 | 1,072 | 11.62% |
| FY2018 | 11,528 | 1,229 | 11.93% |
| FY2019 | 13,277 | 1,749 | 15.17% |
| FY2020 | 13,775 | 498 | 3.75% |
| FY2021 | 18,975 | 5,200 | 37.75% |
| FY2022 | 22,473 | 3,498 | 18.43% |
| FY2023 | 26,196 | 3,723 | 16.57% |
| FY2024 | 29,600 | 3,404 | 12.99% |
| FY2025 | 36,000 | 6,400 | 21.62% |
| FY2026 | 42,000 | 6,000 | 16.67% |
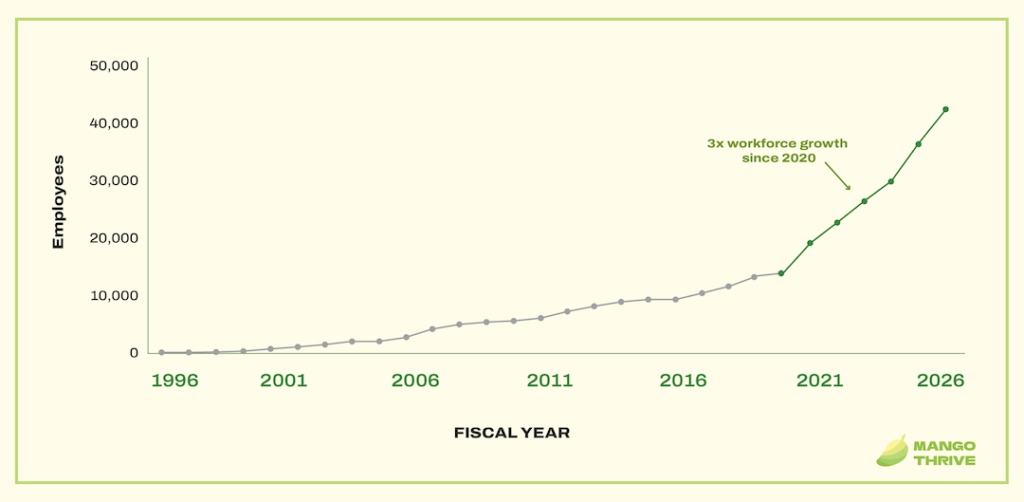
NVIDIA’s long-term growth has been remarkable, scaling from just 42 employees in 1996 to approximately 42,000 in fiscal year 2026—a 1,000-fold increase over 30 years.
NVIDIA Workforce Milestones:
- Exceeded 1,000: FY2002
- Exceeded 5,000: FY2008
- Exceeded 10,000: FY2017
- Exceeded 20,000: FY2022
- Exceeded 30,000: FY2024–2025
- Exceeded 40,000: FY2026
Source: stockanalysis
NVIDIA Employees by Gender
| Fiscal Year | Women % | Men % |
| FY2016 | 17.5% | 82.5% |
| FY2017 | 18.4% | 81.5% |
| FY2018 | 18.6% | 81.4% |
| FY2019 | 18.9% | 80.9% |
| FY2020 | 18.9% | 80.5% |
| FY2021 | 19.1% | 80.3% |
| FY2022 | 19.0% | 80.4% |
| FY2023 | 19.2% | 80.0% |
| FY2024 | 19.7% | 79.4% |
| FY2025 | 21.2% | 77.5% |
According to the latest 2025 figures, the male workforce at NVIDIA stands at 77.5%, while the female workforce is 21.2%.
The overall trend shows that the proportion of female employees has grown from 17.5% (FY2016) to 21.2% (FY2025), an increase of 3.7 percentage points over 10 years.
Source: Nvidia
NVIDIA Employees by Age
The workforce group aged 31 to 50 is exceptionally stable, fluctuating only within the 62%–63.7% range over the past 9 years.
NVIDIA Employee Age Breakdown:
| Fiscal Year | 20–30 Years | 31–50 Years | 51+ Years |
| FY2017 | 24.6% | 62.0% | 13.4% |
| FY2018 | 23.5% | 62.7% | 13.8% |
| FY2019 | 23.4% | 62.5% | 14.1% |
| FY2020 | 22.0% | 63.0% | 15.0% |
| FY2021 | 21.7% | 63.5% | 14.8% |
| FY2022 | 22.7% | 62.8% | 14.5% |
| FY2023 | 22.8% | 62.8% | 14.4% |
| FY2024 | 22.0% | 63.4% | 14.6% |
| FY2025 | 22.3% | 63.7% | 14.0% |
Source: Nvidia
NVIDIA Employees by Region
| Fiscal Year | Americas % | APAC % | EMEA % | India % |
| FY2023 | 49.9% | 16.8% | 19.2% | 14.2% |
| FY2024 | 49.8% | 16.8% | 19.8% | 13.6% |
| FY2025 | 49.7% | 16.9% | 20.2% | 13.3% |
Regional workforce insights show:
- The Americas account for ~50% of the total workforce.
- EMEA saw the strongest growth, rising from 19.2% to 20.2%.
- India experienced the largest decrease in share, dropping from 14.2% to 13.3%.
- APAC remained nearly flat, moving from 16.8% to 16.9%.
Source: Nvidia
NVIDIA Employees by Employee Type
| Fiscal Year | Executive % | Management % | Regular / Individual Contributor % |
| FY2016 | 0.0% | 18.6% | 81.1% |
| FY2017 | 0.2% | 18.1% | 81.6% |
| FY2018 | 0.2% | 18.0% | 81.8% |
| FY2019 | 0.2% | 17.5% | 82.4% |
| FY2020 | 0.2% | 17.9% | 81.9% |
| FY2021 | 0.1% | 18.8% | 81.1% |
| FY2022 | 0.1% | 17.6% | 82.3% |
| FY2023 | 0.1% | 17.2% | 82.7% |
| FY2024 | 0.1% | 16.7% | 83.2% |
| FY2025 | 0.1% | 15.7% | 84.2% |
The long-term downward trend is impressive! Turnover dropped from 13.0% in FY2016 to 2.5% in FY2025, representing an ~80% decrease over 10 years.
Notable periods of decline:
- FY2016 → FY2017: Dropped sharply from 13% to 6.7% (halved).
- FY2020 → FY2021: Dropped from 6.7% to 3.8% during the COVID-19 period.
- FY2023 → FY2024: Significant drop from 5.3% to 2.7%, coinciding with NVIDIA’s market cap surpassing $1 trillion and the AI boom post-ChatGPT.
Source: Nvidia